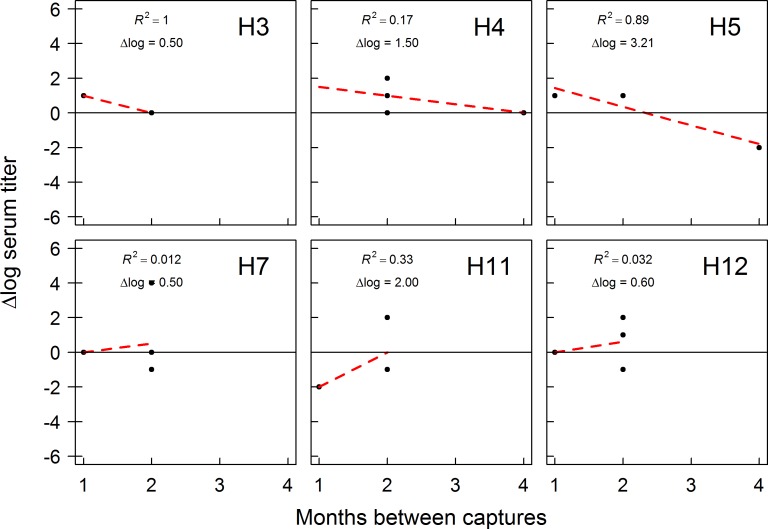
Fig 4. Trends in antibody production to influenza A viruses (IAVs) by mallards sampled in Fairbanks, Alaska.
Mallards were captured and sampled from August 2012 through April of 2013. Analysis included samples obtained from individuals determined to be seropositive on multiple capture occasions with bELISA. Time intervals on the x-axis represent the number of months between first and one randomly selected capture occasion. The dashed red line represents a linear regression trend line and associated R-squared value.

