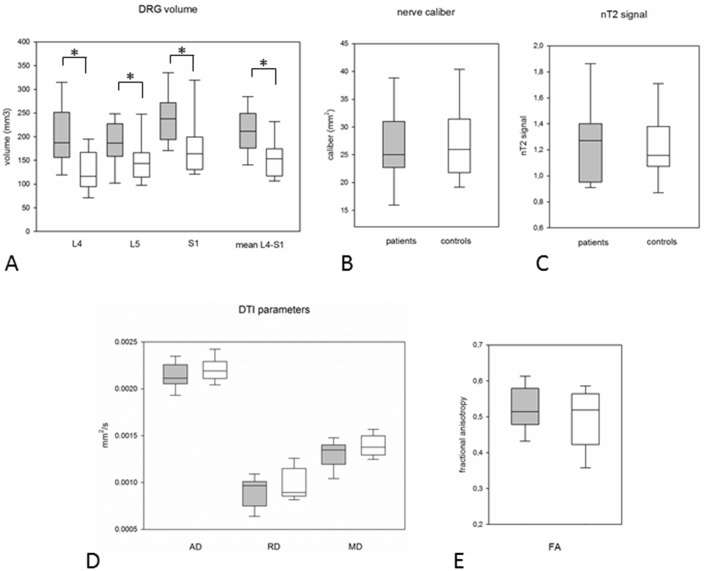
Fig 4. Boxplots of quantitative results.
[A] shows values for DRG in OXA-treated patients (grey boxes) vs. controls (white boxes). [B] shows normalized T2 values for the sciatic nerve at mid-thigh level. [C] gives values for the sciatic nerve caliber at mid-thigh level. [D] shows values for DTI parameters AD, RD, and MD while [E] depicts resulting FA values. Boxplots give median, 25% and 75% quartile values. Whiskers indicate 5% and 95% percentile.

