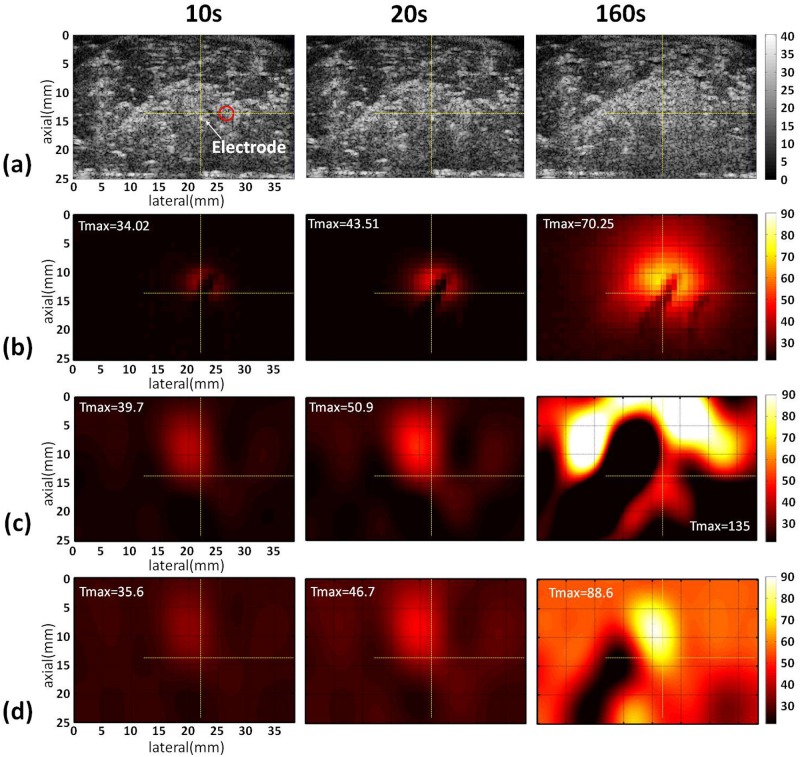
Fig 5. Typical images of the liver sample acquired at different time points during RFA of 20 W.
(a) B-mode images; (b) infrared images; (c) temperature images constructed using constant k; (d) temperature images estimated using adaptive k. The yellow cross marks and red circles in the B-mode images indicate the locations of the RF electrode and thermocouples, respectively. The symbol “Tmax” is the maximum temperature in the temperature images.

