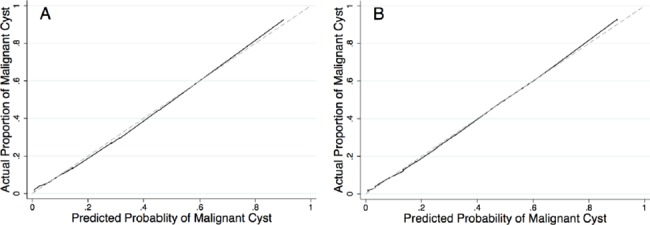
Fig 3.

Calibration plots for assessing the performance of the nomogram to predict ovarian cancer in patients with adnexal masses in (A) the test sample (n = 453) and (B) the validation sample (n = 453). In both (A) and (B), the dashed line represents the ideal reference line where the predicted probabilities estimated from the model would match the observed proportion of patients with ovarian cancer.
