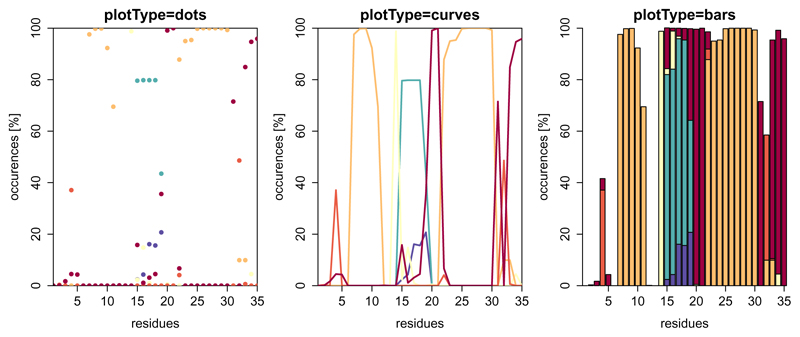
Figure 4.
Example of dssp() with plotType set to ”dots” (default), ”curves” or ”bars”. Note that the fractions do not necessarily sum up to a hundred percent, because some residues might not be in defined secondary structure elements all the time. In this figure, there is no legend plotted due to space limitations (see Figure 5 for a colour-code explanation).

