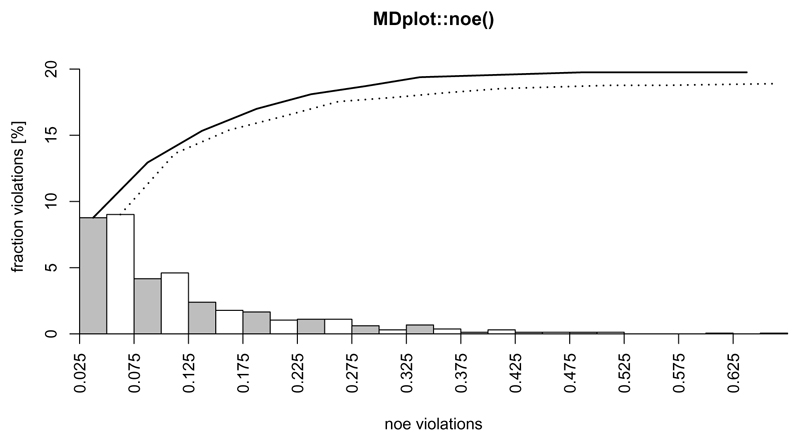
Figure 8.
Example plot showing two different replicates of a protein simulation (they share the same molecule, but have different initial velocities). Note, that the maximum value (x-axis) over all replicates is used for the plot. The sum over all violations from left to right is shown by an additional curve on top. The number of violations may be given as fractions (in %), as shown above, or absolute numbers (flag printPercentages either TRUE or FALSE).

