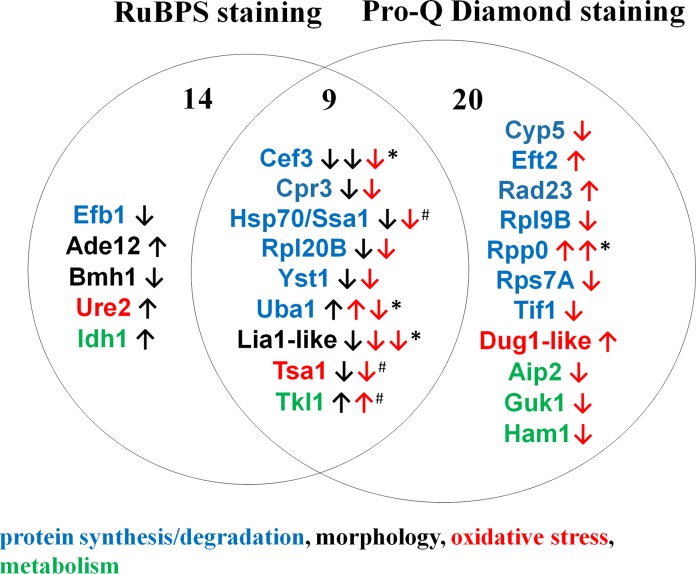
Fig 2. Summary of proteomic results and functional characterisation of the proteins showing significant alterations at protein or phosphorylation level upon CaPPZ1 deletion.
GO functions are indicated by the following color coding: blue: protein synthesis/degradation black: morphology, red: oxidative stress response, green: metabolism. Black and red arrows indicate the directions of changes in RuBPS staining (reflecting protein amounts) and Pro-Q Diamond staining (indicating protein phosphorylation levels), respectively. Numbers indicate the regulated proteins that were stained by either one or both the two dyes. *marks proteins found in two spots (hence the changes are shown by two arrows), and # labels possible moonlighting proteins.

