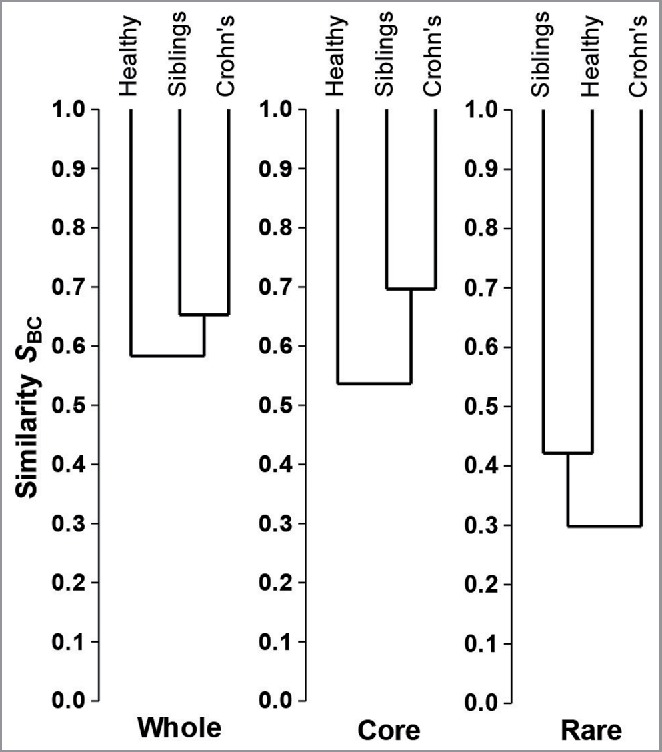
Figure 1.

Dendrogram showing the microbial community dissimilarity between the 3 groups: The composition of the whole microbiota as determined by Bray-Curtis index, is more similar between patients and their healthy siblings than between healthy siblings and healthy controls, and this pattern is driven by similarity in the core microbiota between patients and siblings rather than the rare microbiota.
