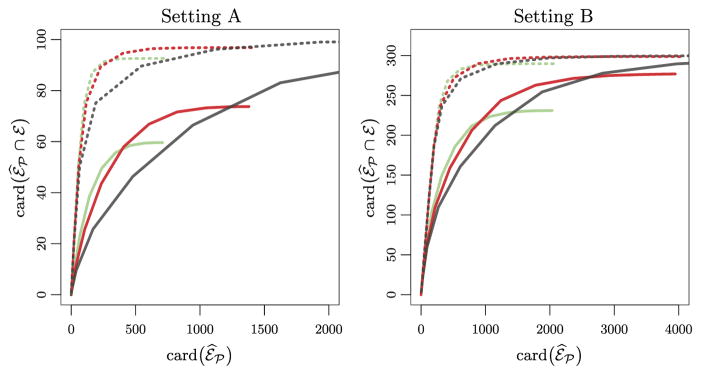
Fig. 4.
The constrained penalized optimization problem (10) was performed, for a range of values of the tuning parameter λ. The x-axis displays the size of the estimated edge set ℰ̂℘ (12), and the y-axis displays the number of true positives, averaged over 200 simulated data sets. The curves represent performance when ζ is chosen to yield card(ℰ̂(ζ)) = 4card(ℰ̃) (T = 300 [
 ]and T = 600 [
 ]), and when ζ is chosen to yield card(ℰ̂(ζ)) = 8card(ℰ̃) (T = 300 [
 ] and T = 600 [
 ]). We also display performance of the unconstrained penalized optimization problem (5) (T = 300 [
 ] and T = 600 [
 ]).
]).

