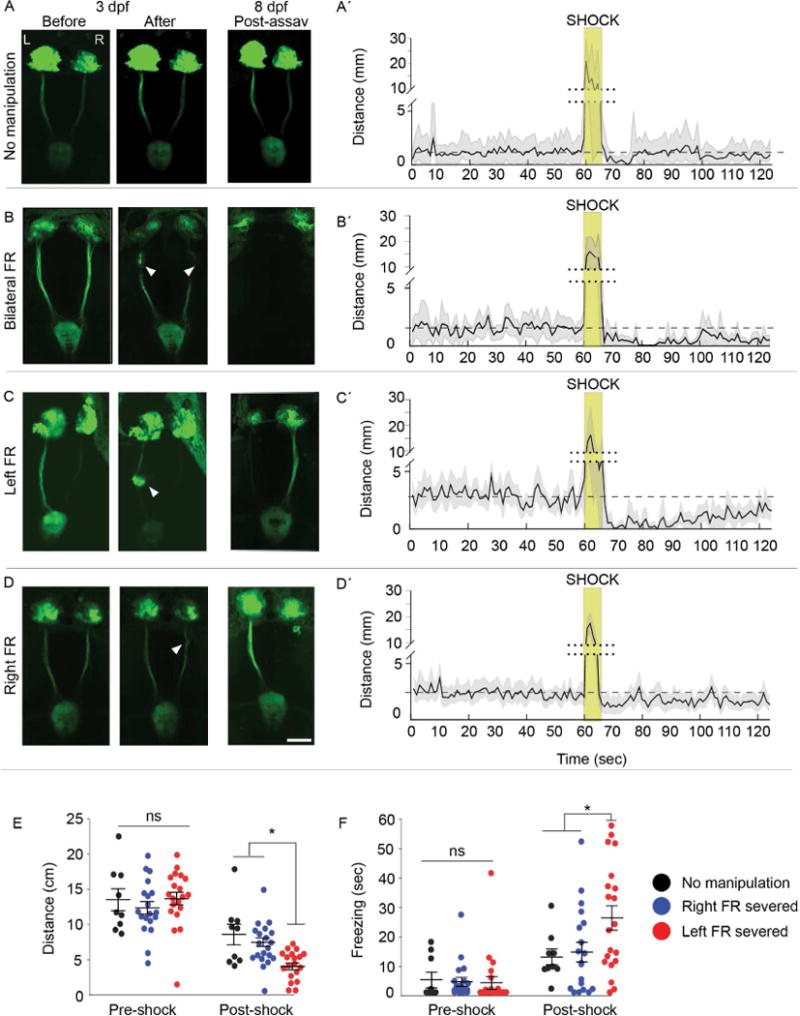
Fig. 1. Intact left dHb-IPN pathway required to mitigate fear behaviors.

(A–D) Live imaging of TgBAC(gng8:nfsB-EGFP-CAAX) larvae with the Hb-IPN pathway (A) intact or before and after (B) bilateral, (C) left or (D) right severing (white arrowheads) of the fasciculus retroflexus (FR) at 3 d. FR lesions were confirmed at 8 d following behavioral testing. The left (L) and right (R) dHb are indicated. Scale bar is 50 m. (A′–D′). Corresponding locomotor activity measured in 1 sec intervals pre- and post-shock. Mean activity (solid black line) relative to pre-shock levels (dashed line), and standard error (light gray) are indicated. The y-axis is split (dotted line) to include heightened activity during shock (gold box). (E) Locomotor activity was decreased in larvae with the left FR severed (n=20; Kruskal-Wallis ANOVA H=54.35, p<0.0001; Dunn’s post-test; p<0.05) relative to uncut controls (n=9) or those with the right FR severed (n=19), and (F) duration of freezing also increased (n=20; Kruskal-Wallis ANOVA H=35.75, p<0.01; Dunn’s post test, p<0.05). Horizontal bars representing mean ±SEM for 1-min intervals pre- and post-shock are superimposed over scatter plots of individual larvae (circles). No significance (ns) and significance below p=0.05 (*) are denoted. See also Figure S1 and S2.
