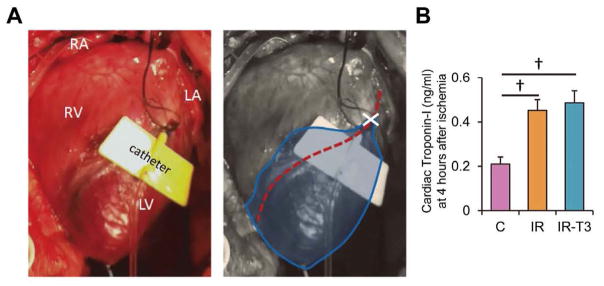
Figure 2.
Ischemic injury area. (A) Piglets were exposed to 10 min of coronary occlusion by left anterior descending coronary artery (LAD) ligation. Ischemic injury area is surrounded by a blue line. Red dot line, LAD; X mark, ligation point of LAD. A catheter with yellow wings was inserted into the LAD for the infusion of 13-Carbon (13C)-labeled substrates. RA, right atrium; LA, left atrium; RV, right ventricle; LV, left ventricle. (B) Plasma cardiac troponin-I concentration at 4 h after starting ECMO. Values are presented as mean ± SE; n=5–6 per group. †P<0.01 vs. Group-C. Group-C, control group.

