Figure 3.
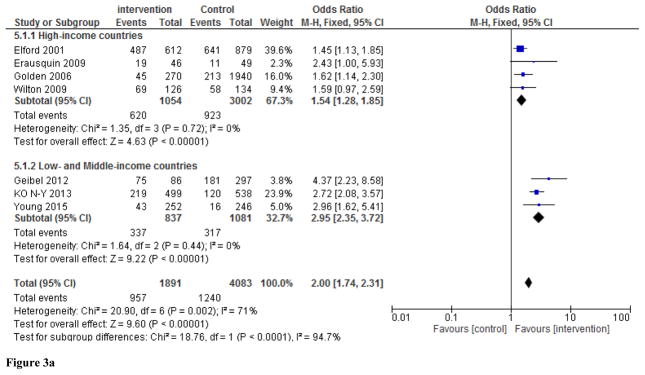
Figure 3a. Subgroup analyses by socio-economic status of study site (high-income versus low-and middle-income country). Values show study-specific and overall sizes of the effect of peer-led interventions on rate of HIV testing among MSM.
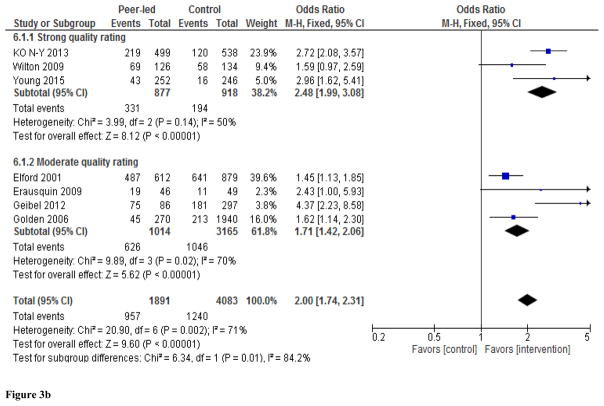
Figure 3b. Subgroup analyses by quality rating assigned to study. Values show study-specific and overall sizes of the effect of peer-led interventions on rate of HIV testing among MSM.


