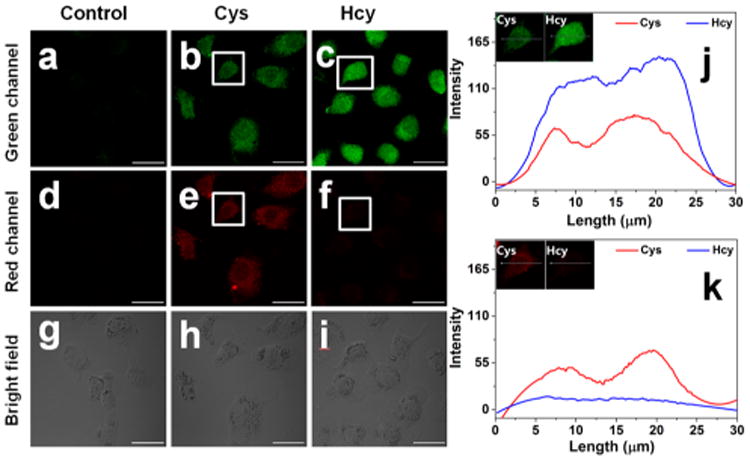
Figure 5.

(a, d, g) Confocal fluorescence image of HepG2 cells preincubated with 1 mM NEM for 30 min and further incubated with HBSS (Hanks' Balanced Salt Solution (with Ca2+, Mg2+)) of pH 7.8 in the presence of 10 μM nigericin and 5 μM probe 1 for 30 min. (b, e, h) Using the control procedures, the cells were further incubated with 100 μM Cys in HBSS of pH 7.8 in the presence of 10 μM nigericin for 60 min. (c, f, i) Using the control procedures, the cells were further incubated with 100 μ;M Hcy in HBSS of pH 7.8 in the presence of 10 μM nigericin for 60 min. (j, k) Cross-sectional analysis along the white line in the insets (single cell in white squares in (b) and (c), (e) and (f) respectively). λex = 458 nm; scale bar =30 μm. Green channel: 500 ± 20 nm; Red channel: 600 ± 25 nm.
