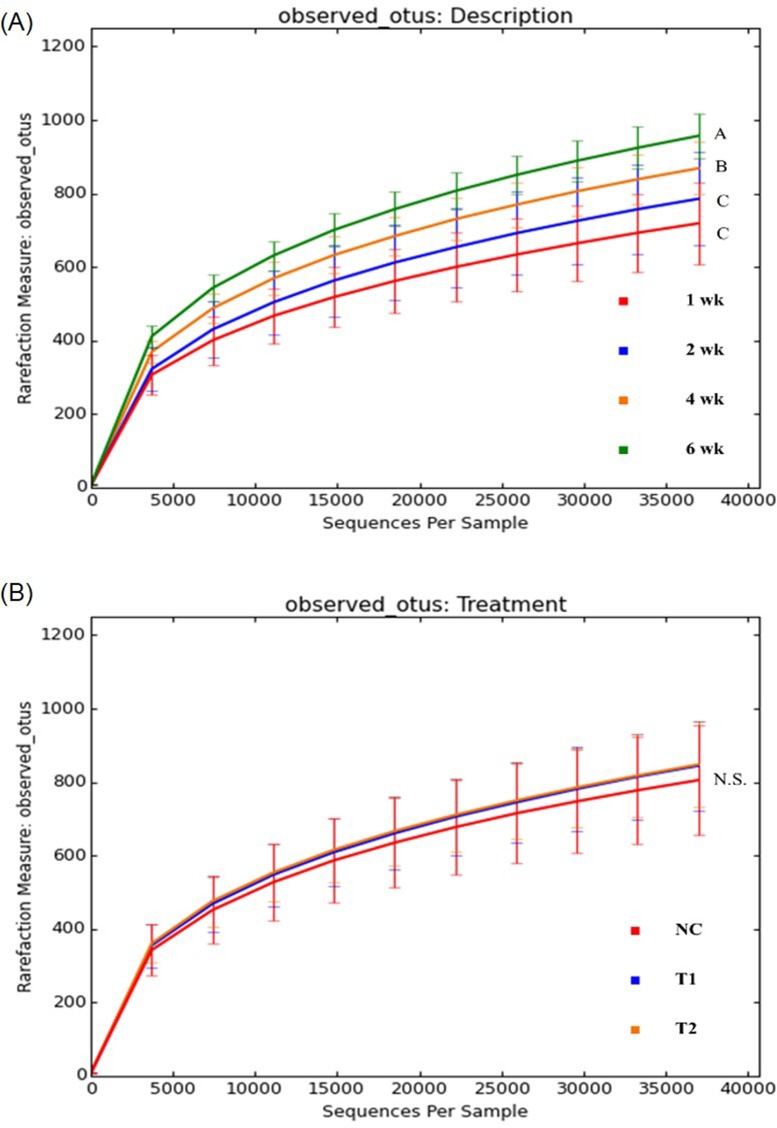
Fig 4. Rarefaction plots indicating amount of diversity by treatment (NC: Feed only; T1: 0.05% BMD 50; T2: 0.2% Biolex® MB40).
A: Rarefaction plot by bird age; B: Rarefaction plot by treatments. (Different letters indicate significant differences, P value < 0.05, N.S. stands for no significant difference)

