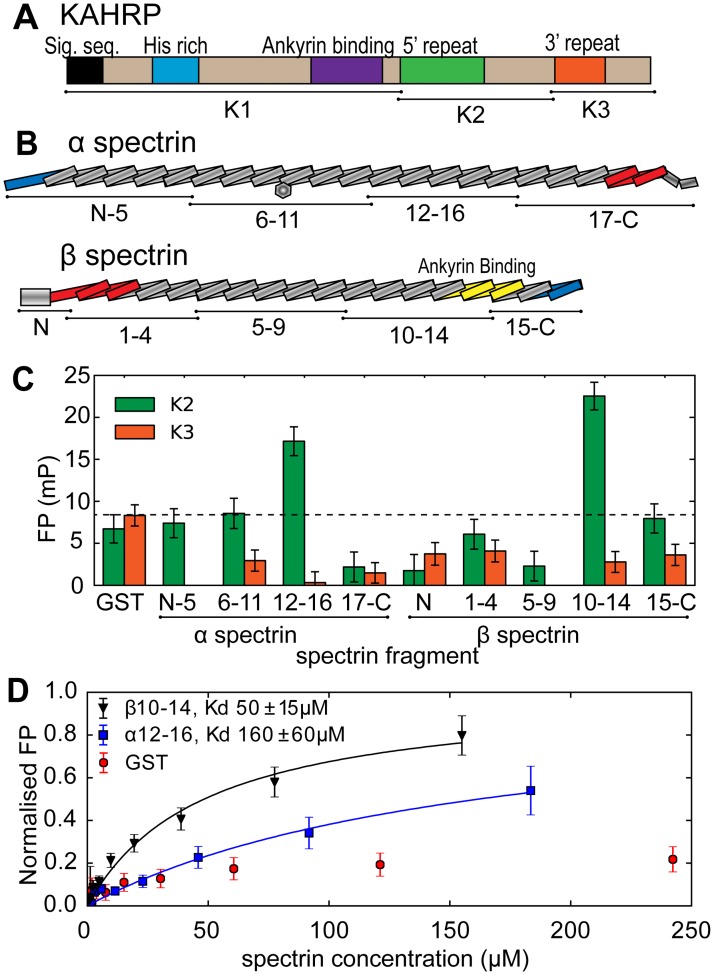
Fig 1. KAHRP associates with spectrin.
(A,B) Schematic representations of KAHRP (A) and the spectrin α and β chains (B). KAHRP and spectrin fragments used in this study are denoted. The spectrin hetero-dimerization region is indicated in blue and the tetramerization region in red. (C) FP binding assay of KAHRP showing polarization differences (mP) upon incubation of fluoresceine-labeled K2 or K3 fragments with 50 μM of unlabeled spectrin constructs. Higher polarization differences correspond to slower tumbling rates of labeled KAHRP due to complex formation. The dotted line indicates polarization differences upon incubation with glutathione-S-transferase (GST, negative control). (D) FP titration of labeled K2 with unlabeled β10–14 and α12–16. Solid lines are fits of single site binding models; FP values were normalized to predicted maxima from the fits. The calculated interaction affinities (Kd) are shown. Panels C and D show representative data from two independent experiments, while error bars indicate one standard deviation derived from four technical repeats.

