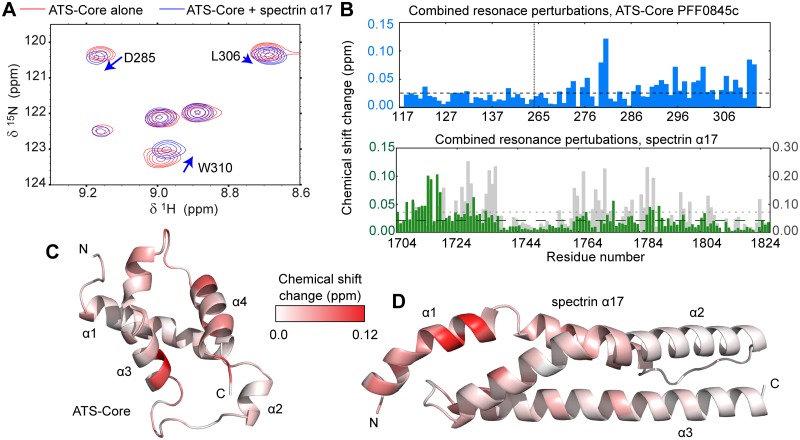
Fig 5. Mapping the ATS-Core–spectrin α17 binding on the domain structures.
(A) Detail from NMR 15N-HSQC spectra of 50 μM 15N-labeled ATS-Core PFF0845c alone (red) or with two-fold excess of unlabeled α17 (blue). Spectra were recorded at 300 mM NaCl and 40°C. (B) Combined perturbations of 1H, 15N and 13C´ NMR peak positions upon ATS-Core–spectrin α17 binding under the conditions of (A), as function of ATS-Core PFF0845c (blue) and spectrin α17 (green) amino acids. Combined perturbations of 1H and 15N NMR peak positions for α17 upon ATS-Core binding at 50 mM NaCl and 25°C are also shown (grey); NMR peak perturbations are broadly similar under both experimental conditions. Mean perturbations in NMR peak positions are shown as dashed lines. The position at which PfEMP1 segments are joined to form the ATS-Core is indicated by a dashed line in the top graph. (C,D) Visualization of NMR peak position perturbations upon ATS-Core–α17 binding on (C) the ATS-Core and (D) the α17 structure. The color gradient indicates the magnitude of perturbations observed; thus, it is proportional to structural changes upon complex formation allowing the visualization of the direct interaction interface. The ATS-Core PFF0845c structure was derived by homology modeling using the ATS-Core PF08_0141 structure [31] as template. The two constructs feature 70% sequence identity and 92% sequence similarity. The α17 structure derives from a 1.54 Å resolution crystallographic model of spectrin repeats α16–17 (See S10 Fig and Table 2 for an analysis of α16–17 structure).

