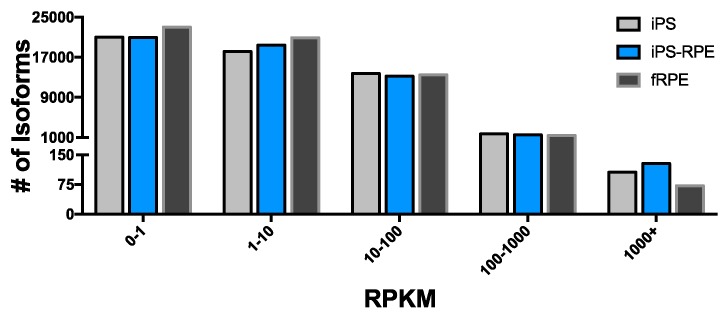
Fig 1. Distribution of transcriptome gene expression.
Total number of isoforms with RPKM in each of 5 bins is shown for iPS, iPS-RPE, and fRPE. Isoforms with RPKM greater than 1 are considered to be expressed. The majority of expressed isoforms have RPKM less than 100 for all samples, with very few isoforms having RPKM greater than 1000.

