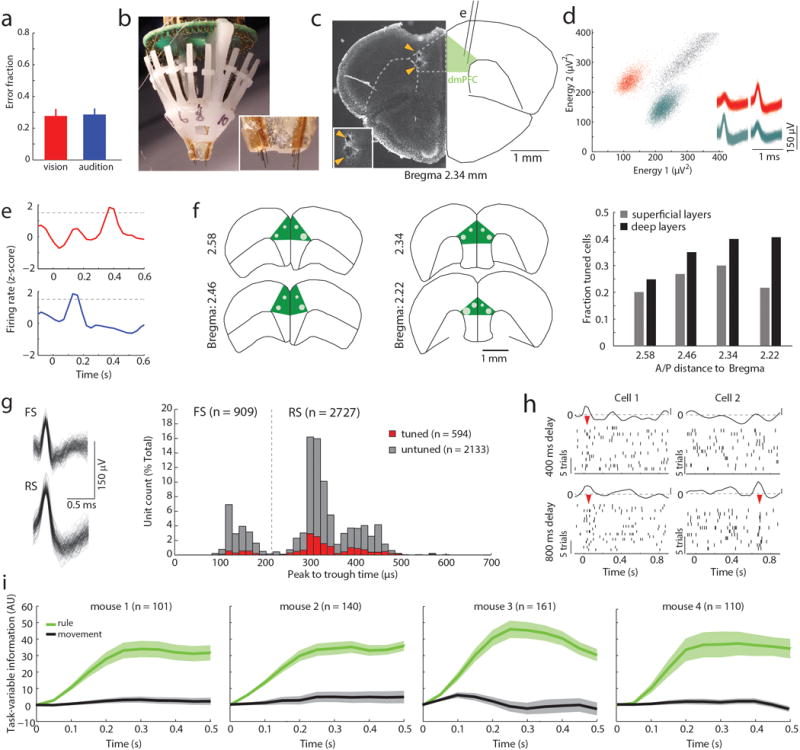
Extended Data Figure 1. Behavioral and electrophysiological features reflected in the 2 AFC task.

(a) Mice display equal performance across trial types (n = 4 mice, p = 0.52, Wilcoxon rank-sum). (b) Multi-electrode implant used for PFC neural recordings. Inset: magnification showing electrodes. (c) Postmortem histology in an example brain showing electrode tip locations (arrowheads). (d) Example of spike sorting in energy space to identify single units. Two identified clusters reflect two single units (color coded). Inset: Corresponding spike-waveforms. (e) In 17% of rule-tuned cells, tuning is observed for both task rules (example PSTHs shown), albeit with distinct temporal offsets during the delay. (f) Schematic showing electrode locations from which rule-tuned neurons (white dots) were recorded, illustrating that they are most frequently found in deeper layers. Dot sizes are scaled in proportion to the number of tuned neurons found at that location (n = 594 cells from 4 mice). (g) Fast spiking (FS) and regular spiking (RS) neurons are identified based on the peak to trough time of their spike waveform (left: example waveforms, right: peak to through time histogram, dashed line represents cut off for FS - RS classification21,29). (h) Example rasters and PSTHs for two cells during delay periods of either 400 or 800 ms, randomized within the same recording session. In the first, an early peak is present in both conditions (left) while in the other a late peak is only evident in the 800 ms condition (right). (i) Task-variable information for each mouse of our first cohort (‘manipulation free’). Task-variable information is based on PCA from the divergence of population activity of task modulated PFC neurons on the axis associated with each variable (see methods) and is highly informative for task rule (green) but contains no information about movement (side selection, grey). Shaded areas indicate the bootstrapped 95% confidence intervals.
