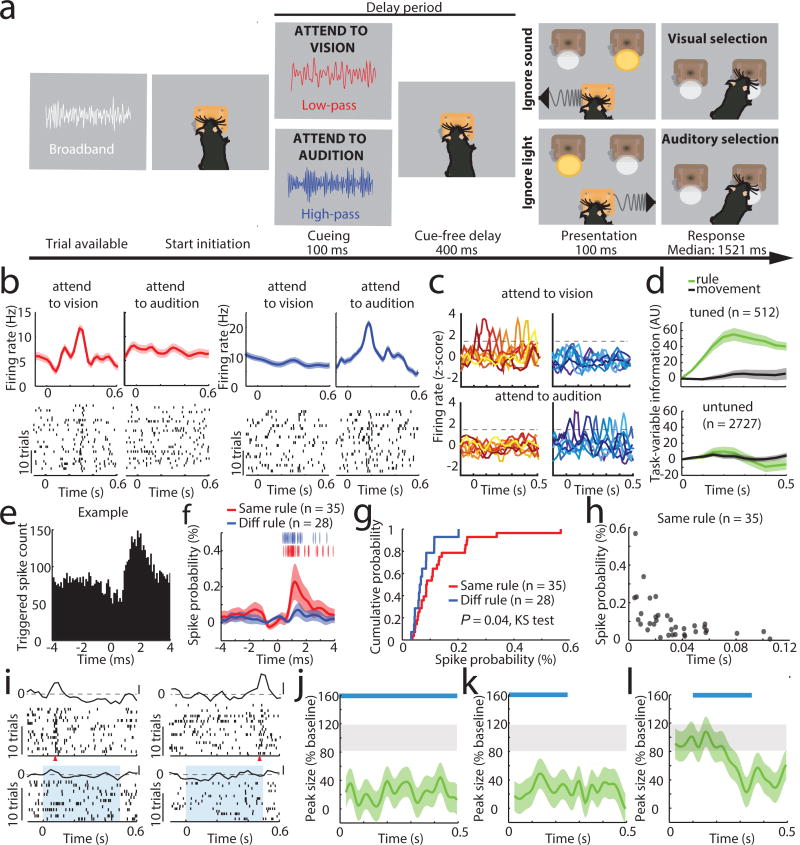
Figure 1. Task-specific sequential PFC activity maintains rule representation.
(a) Schematic of task design. (b) Example peri-stimulus time histogram (PSTH) and rasters for neurons tuned to either ‘attend to vision’ (red) or ‘attend to audition’ (blue) rules. (c) Examples of tuning peaks across multiple sessions. (d) Task-variable information, indicates that tuned neurons (n = 512 neurons from 4 mice) reflect rule information (top, green), but not movement (top, grey), but unturned neurons do not (n = 2727, bottom) (e) Example spike time cross-correlation between two neurons (50 μs bins), indicating a putative monosynaptic connection. (f) Putative monosynaptic connections in same rule tuned pairs showed a significantly larger average peak. Vertical ticks indicate peak times. (g) Cumulative plot showing cross-correlation values for each pair. (h) Same rule tuned pairs with putative monosynaptic connections had overlapping tuning peaks (i) Raster and PSTH examples showing diminished turning during optogenetic activation of inhibitory neurons (blue shading indicates laser). (j) Quantification of laser impact on peak sizes (n = 94 neurons, 3 mice; example in Extended Data Figure 3j). (k–l) Temporally-limited optogenetic manipulations (blue bars) indicate that later tuning depends on earlier activity. Shading indicates 95% confidence intervals.

