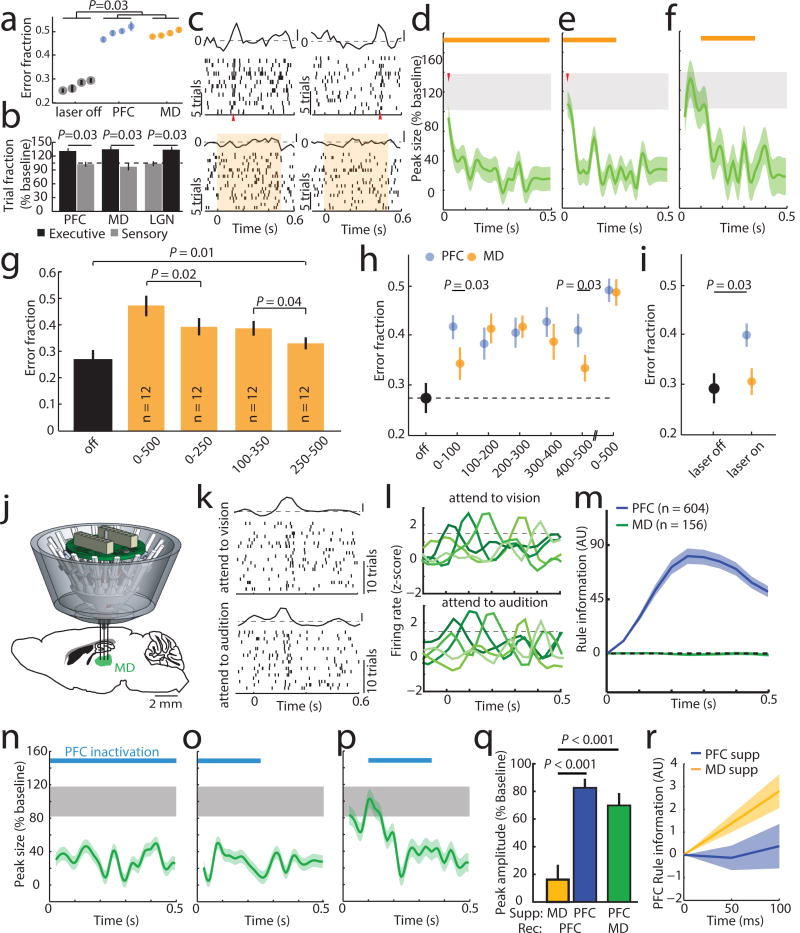
Figure 2. Categorically-free MD activity is required for PFC rule representation and task performance.
(a) Delay-limited PFC or MD inhibition diminishes task performance. (4 sessions, n = 4 mice each). (b) Delay-limited PFC or MD inhibition in the 4AFC task selectively increases executive errors while LGN suppression selectively increases sensory ones (n = 4 mice per group). (c) Raster and PSTH examples of PFC rule tuning with MD suppression (shading denotes laser). (d) Population quantification of c as in Figure 1j (n = 58 neurons). (e–f) Temporally-limited MD suppression effects on population tuning (e, n = 43 neurons; f, n = 46 neurons3 mice with 4 sessions per condition). (g) Comparison of behavioral performance with full and temporally limited MD suppression (n = 3 mice with 4 sessions each). (h) Effect of short duration (100 ms) suppression of PFC or MD across the delay on performance. (i) Effect of MD suppression with short delay (20 ms) trials. (j) MD recordings schematic. (k) Raster and PSTH example of an MD neuron showing similar peaks in both trial types. (l) Example PSTHs of five MD neurons showing consistent lack of rule-specificity. (m) Linear decoding fails to reveal rule information in MD neurons with peaks (PFC: n = 604 neurons, 6 mice, MD: n = 156 neurons, 3 mice). (n-p) MD peak elimination by PFC suppression, (full: n = 47 neurons, early: n = 34 neurons; middle: n = 36 neurons; 2 mice with 4–5 sessions each). (q) Effects of MD (yellow) and PFC (blue) suppression on the first 50 ms of PFC tuning. MD suppression produces a small effect on early PFC peaks (n = 101 neurons, 3 mice) relative to local PFC suppression (n = 146 neurons, 3 mice) while PFC suppression strongly reduced early MD tuning (green, n = 81 neurons, 2 mice). (r) Early rule information is preserved with MD, but not PFC suppression (decoding as in Figure 1. MD: n = 101 neurons, 3 mice; PFC: n = 146 neurons, 3 mice). Shading indicates 95% confidence intervals. Wilcoxon rank-sum test was used for all comparisons. Data is presented as mean ± SEM.

