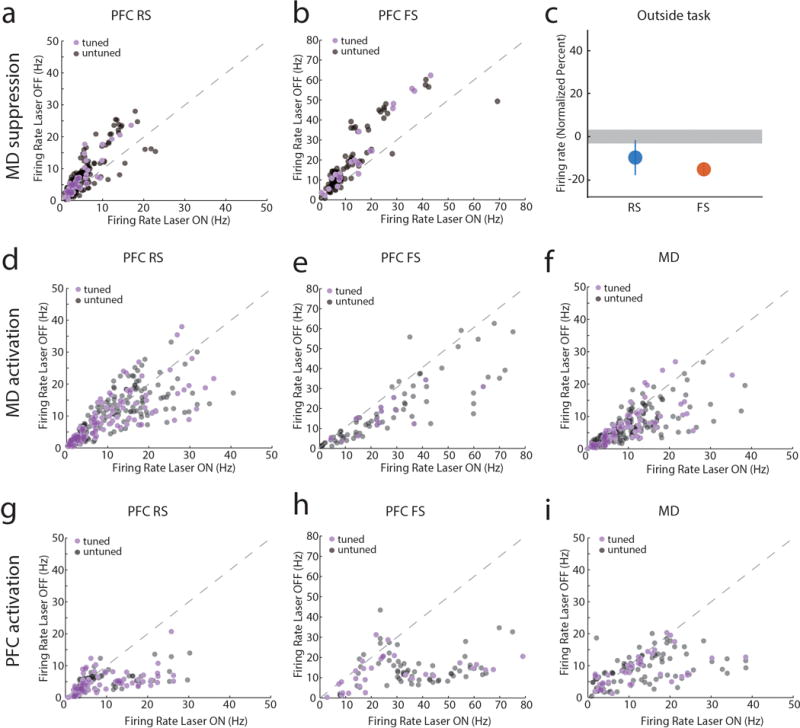
Extended Data Figure 8. MD→PFC and PFC→MD pathways are functionally asymmetric.

(a, b) Scatter plots comparing firing rates of PFC neurons during the delay period with and without MD suppression (each data point represents a neuron). (a) RS and (b) FS cells significantly show reduced firing when MD is optogenetically suppressed during the task delay period (P < 0.001). (c) In contrast, MD suppression outside of the task only reduces FS firing rates (RS: n = 245 neurons, FS: n = 114 neurons, data is presented as mean ± CI, grey shading indicates 95% CI of null distribution). (d) Increasing excitability in MD through activation of SSFOs has no effects on RS neuronal firing rate (n = 303 neurons, P > 0.05) but (e) significantly increases FS spiking (n = 131 neurons, P < 0.001) and (f) MD spiking (n = 254 neurons, P = 0.001). (g) The same manipulation in PFC increased firing rates in cortical RS neurons (n = 140 neurons, P < 0.001), (h) FS neurons (n = 91 neurons, P < 0.001) and (i) MD neurons (n = 111 neurons, P = 0.004). (j) All scatter plot data was compared using Wilcoxon signed-rank test. Other than panel c, the scatter plots are the raw data used for the normalized values in Figure 3.
