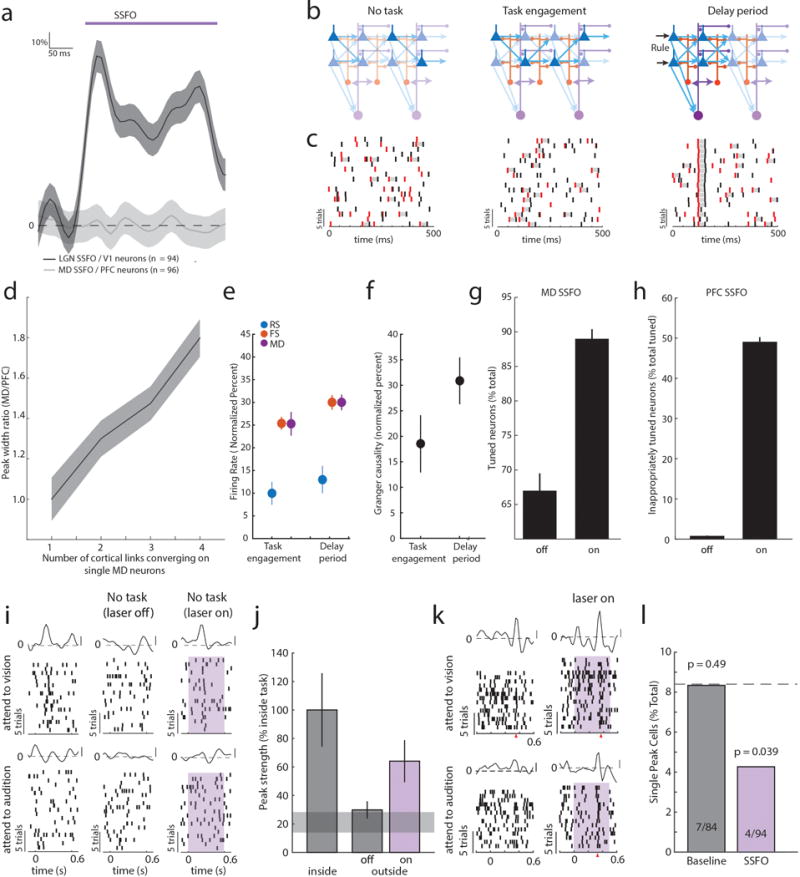
Extended Data Figure 9. Experimental and modeling results clarifying the novel attributes of the MD/ PFC network.

(a) While LGN activation drives spiking in V1, MD activation does not drive spiking in PFC. (b) Schematic of the conceptual model based on the data showing MD, cortical FS and RS neurons in the three different conditions: outside task, task engaged and during the delay period. Triangles represent PFC RS cells that are all tuned to a single rule, and send convergent input to MD neurons (purple). MD sends a modulatory like signal that enhances spiking in FS cells and amplifies connections among RS cells. Task engagement enhances MD activity and in turn FS neural activity. Rule information is simulated as synchronized input to starter RS neurons, which triggers convergent input onto one another, as well as that on MD, resulting in progression of the RS neural sequence in time. (c) Example data from spiking neural model capturing illustration in (b): spike rasters of two RS cells (red: cell 1 and black: cell 2) at different positions within a chain showing corresponding changes in activity during the three conditions. Note that overall spike rates don’t change, but coordinated spiking (gray shadings) increases. (d) Systematically exploring the degree of convergence in the MD/PFC model suggests that 3–4 links in the PFC chain converge onto individual MD neurons (n = 250 neurons, 3 simulations per condition). (e) The model captures the firing rate and (f) connectivity changes observed experimentally. (g) In the modeled MD/PFC network, enhancing excitability in MD neurons by 10% significantly increases the number of rule tuned cells in the PFC population (n = 250 neurons, 10 simulations, data is mean ± SEM, P = 0.002, Wilcoxon rank-sum). (h) Enhancing excitability in the PFC population by 8% drastically increased the proportion of neurons that show inappropriate tuning to both rules (n = 250 neurons, 10 simulation, P = 0.002, Wilcoxon rank-sum). (i) Example spike raster from a neuron tuned to one rule, showing that MD activation is sufficient to generate appropriate tuning outside the task. (j) Population data shows that MD activation is sufficient to partially generate tuning outside the task (n = 2 mice, 31 tuned neurons). Grey shading indicates 95% CI of null distribution. All data is presented as mean ± 95% CI, separation indicates P < 0.05. (k) Example of the effect of SSFO-based activation on an MD neuron containing only one peak showing the addition of a second peak at the same timepoint in the opposite trial type. (l) Relative to the population average (8.4%, dotted line), MD neurons showed significantly fewer single peaks in the SSFO condition despite the presence of an average number of single peaks in the same neurons without SSFO (cumulative binomial test vs population average, p values as shown).
