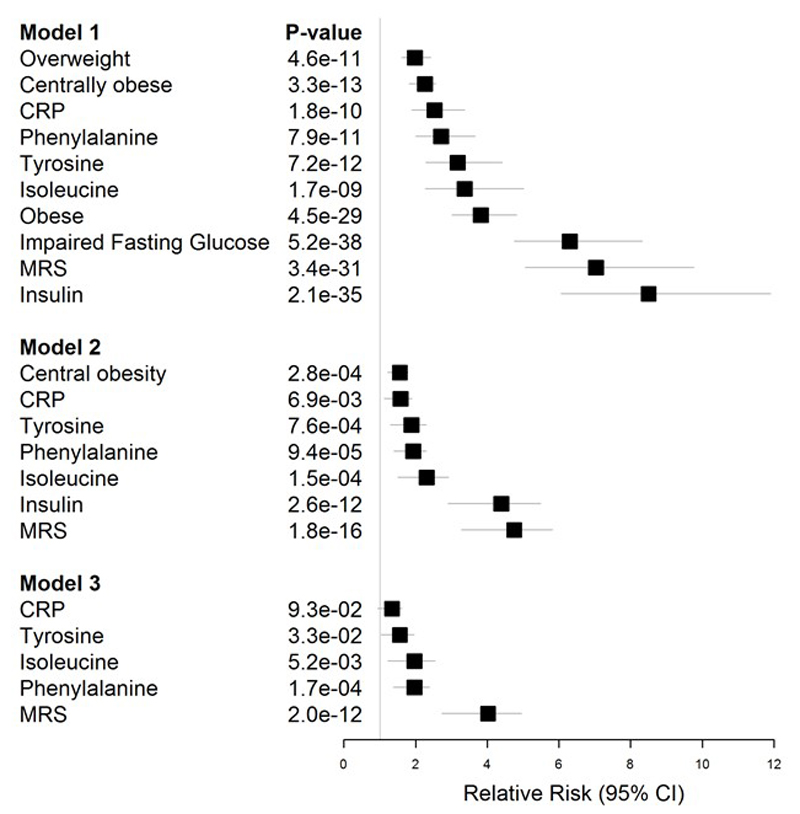
Extended Data Figure 10.
Association of established and emergent biomarkers with T2D. Results are presented as risk of T2D associated with the specified biomarkers in three models: i. Model 1 – adjusted for age and sex; ii. Model 2 – as for Model 1, but additionally for body mass index and impaired fasting glucose; iii. Model 3 – as for Model 2, but additionally for central obesity and insulin concentrations. CRP: C-reactive protein; MRS: methylation risk score. Results for quantitative traits (amino acids, CRP, insulin, MRS) are presented as risk of T2D in Q4 compared to Q1.

