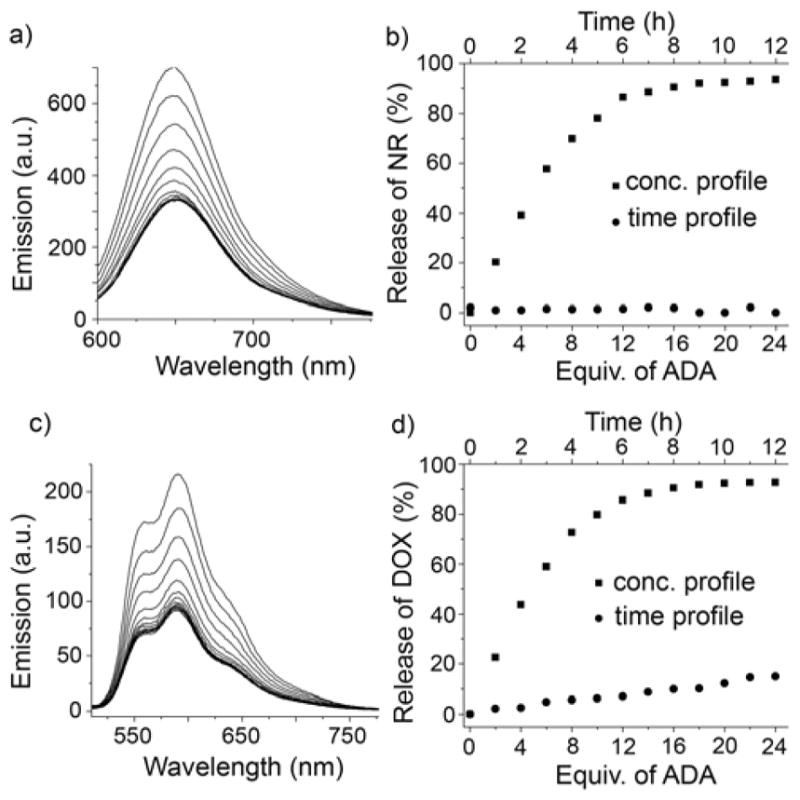
Figure 3.

a) Fluorescence titration of NR@MOP2 ([NR] = 5 μM) with ADA (λex = 580 nm) in water. b) Plot of release of NR (%) based on emission intensity at 650 nm for NR@MOP2 in the absence of ADA versus time and separately with increasing concentration of ADA. c) Fluorescence titration of DOX@MOP2 ([DOX] = 20 μM) with ADA (λex = 488 nm) in water. d) Plot of release of DOX (%) based on emission intensity at 590 nm for DOX@MOP2 in the absence of ADA versus time and separately with increasing concentration of ADA.
