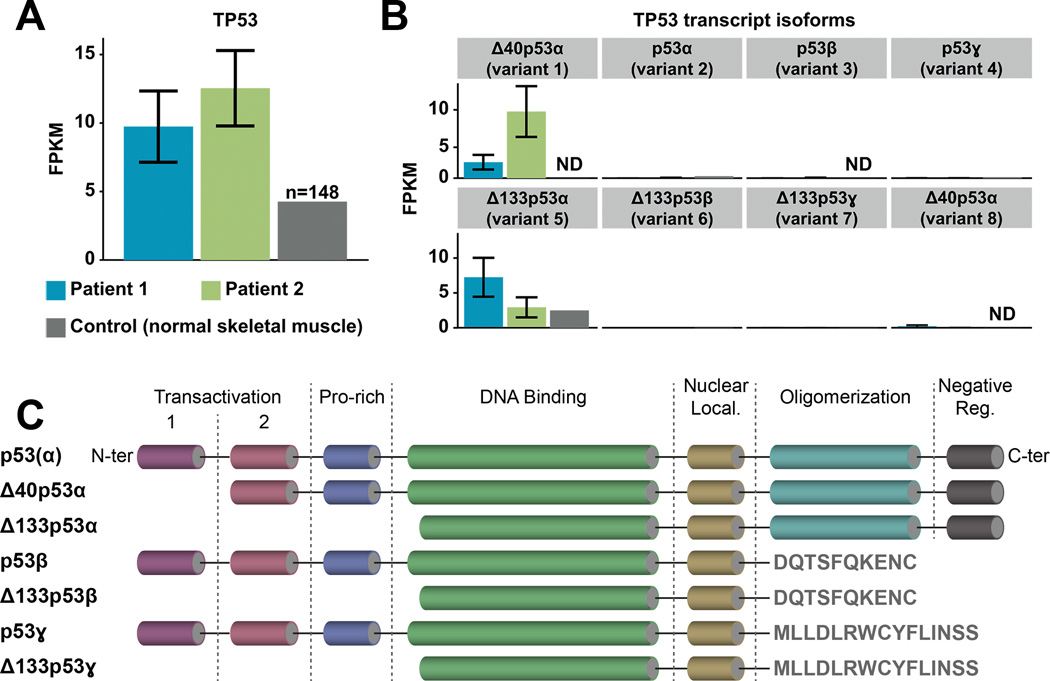
Figure 2. Mutant TP53 expression and isoforms.
A. TP53 gene expression levels quantified in FPKM (Fragments Per Kilobase of transcript per Million fragments mapped) for Patient 1 (blue), Patient 2 (green), and normal skeletal tissue (grey, dbGAP accession number: phs000424.v6.p1; FPKM=4.3; n=148 samples). Each expression value is annotated with error bars reflecting the uncertainty in assigning reads to transcripts (estimated by Cufflinks statistical model), and indicating the lower and upper bound of the 95% confidence interval on the gene FPKM value. B. Expression levels of TP53 transcript isoforms between the two patients and normal skeletal muscle (ND, not detected): Δ40p53α (variants 1 and 8; GeneBank accession numbers NM_001276760 and NM_001126118 respectively), p53α (variant 2; NM_001126112), p53β (variant 3; NM_001126114), p53ɣ (variant 4; NM_001126113), Δ133p53α (variant 5; NM_001126115), Δ133p53β (variant 6; NM_001126116) and Δ133p53ɣ (variant 7; NM_001126117). C. Structural organization of the canonical p53 protein and its isoforms (from N- to C-termini: transactivation domains 1 and 2, proline-rich domain, DNA binding domain, nuclear localization domain, oligomerization domain and negative regulation domain).

