
Figure 1.
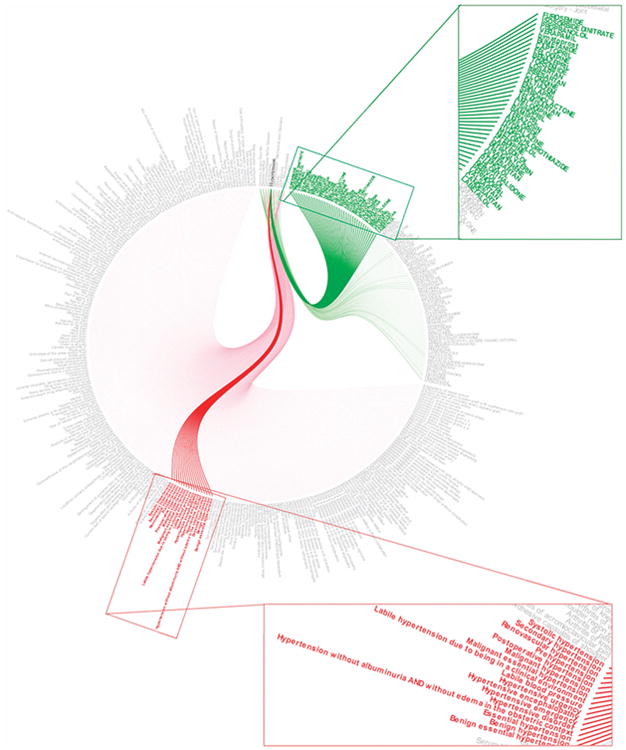
An example of 10 diseases mapped in the disease–drug database, specifically highlighting “hypertension.” Red links represent SNOMED diseases associated with one of the 10 diseases, and green links represent drugs associated with one or more of the 10 diseases.