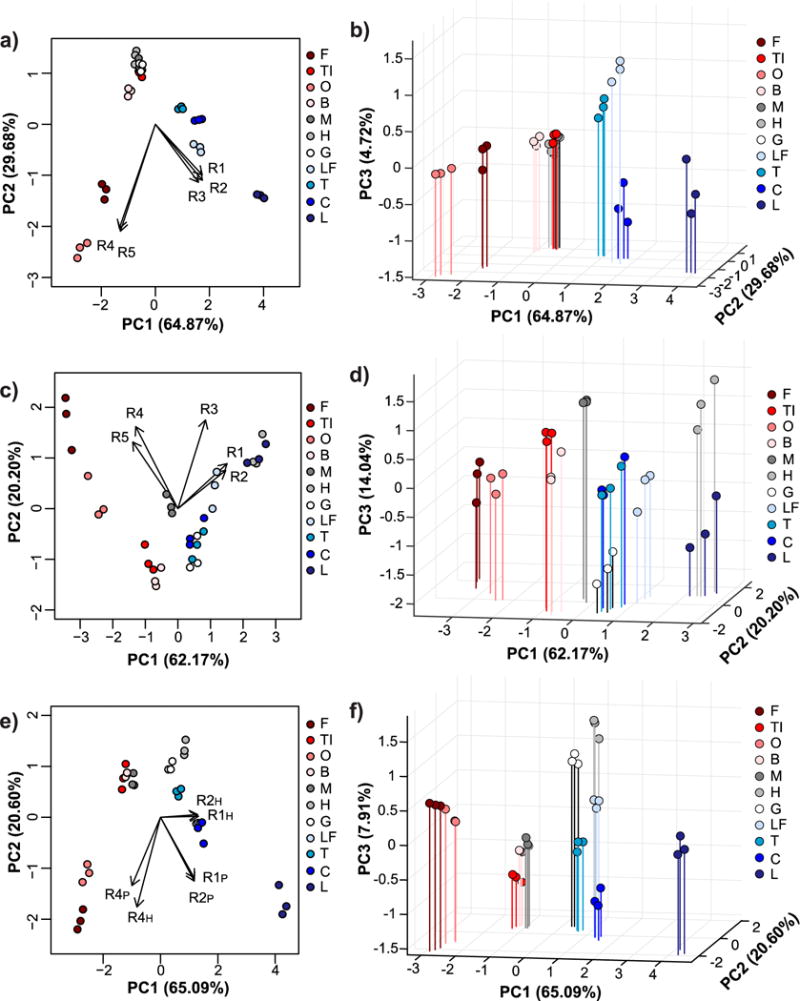
Figure 3. Principal component analysis of relative turbidity changes upon protein binding to nanogels.

Two-dimensional (a, c, e) and three-dimensional PCA biplots (b, d, f) correspond to data for protein binding experiments performed with all five nanogels in 0.1X PBS (a and b), with all five nanogels in 0.1X HBS (c and d), or with only R1, R2, and R4 nanogels in both buffers (e and f). Red shades = low pI proteins (pI < 6.0), gray shades = near-neutral pI proteins (6.0 ≤ pI ≤ 8.0), blue shades = high pI proteins (pI > 8.0). In all cases, protein and nanogel concentrations were 0.5 mg/mL.
