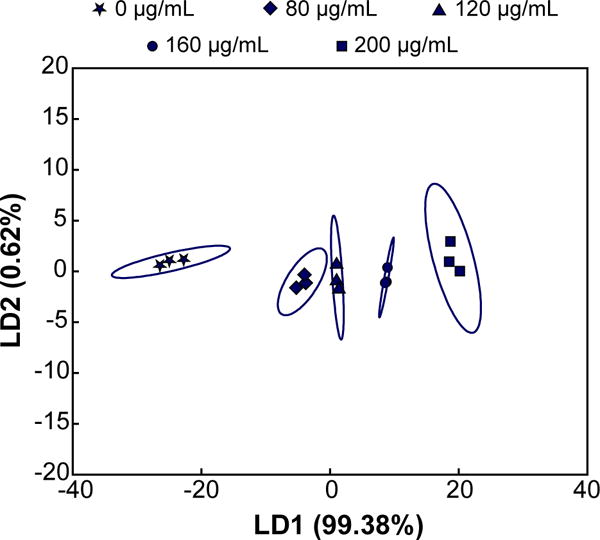
Figure 5. Multivariate analysis of relative turbidity changes upon varying lysozyme concentration in a dilute (1/10) simulated tear fluid.

LDA plot with 95% confidence ellipses demonstrates that the majority of variance is contained within the first linear discriminant when lysozyme concentration is varied from 0 μg/mL to an average healthy concentration (200 μg/mL). Concentrations less than 100 μg/mL (i.e., 1 mg/mL in undiluted tears) are indicative of dry-eye or Sjögren’s syndrome.
