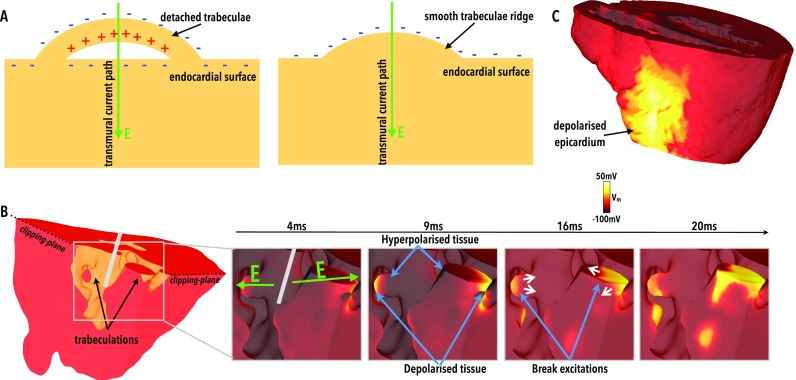
FIG. 2.
Depolarised VEs due to detached trabeculation. (a) Schematic diagram showing an example of a detached (left) and attached (right) trabeculae along with the resulting VE formation due to current movement. (b) Highlighted region of the RV endocardial surface (left) showing two detached trabeculations. 4, 9, 16, and 20 ms panels (right) demonstrate the evolution of Vm distributions at these respective times following a shock of SS 5 V, CI 280 ms (relatively refractory tissue). Green arrows in 4 ms panel show the direction of electric field, with the location of the catheter schematically highlighted in grey. (c) Epicardial view of the same shock as in panel B showing depolarised regions of the epicardial surface.

