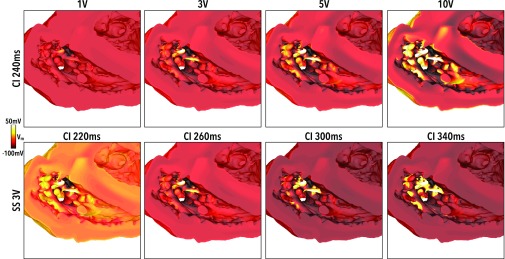
FIG. 3.
Effect of shocks on the endocardial surface looking into RV. Shock-end Vm distributions for (upper panels) a fixed initial tissue state (CI 240 ms) as the SS increases from 1 to 10 V, and (lower panels) a fixed applied SS (3 V) as the initial tissue state varies between CI of 220 and 340 ms.

