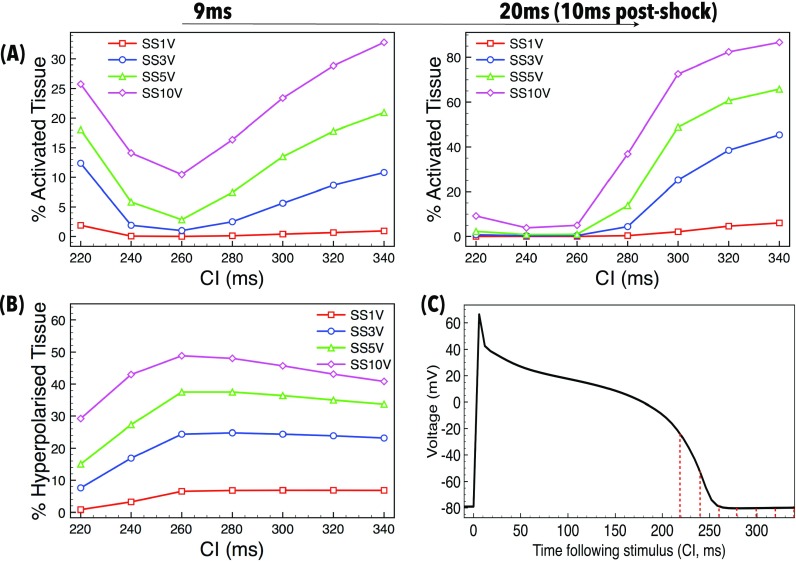
FIG. 6.
Quantification of endocardial activation as a function of applied SS and tissue refractoriness (CI). (a) Percentage of the endocardial surface activated (Vm > −20 mV) by the shock 9 ms (left) and 20 ms (10 ms post-shock, right) after shock initiation as a function of CI for different applied SSs. (b) Percentage of the endocardial surface hyperpolarised (<−80 mV) by the shock 9 ms after shock initiation as a function of CI for different applied SSs. (c) Change in Vm over time following preconditioning stimulus, showing the refractory state of tissue when each shock is applied (CI, shown by red dotted-lines).

