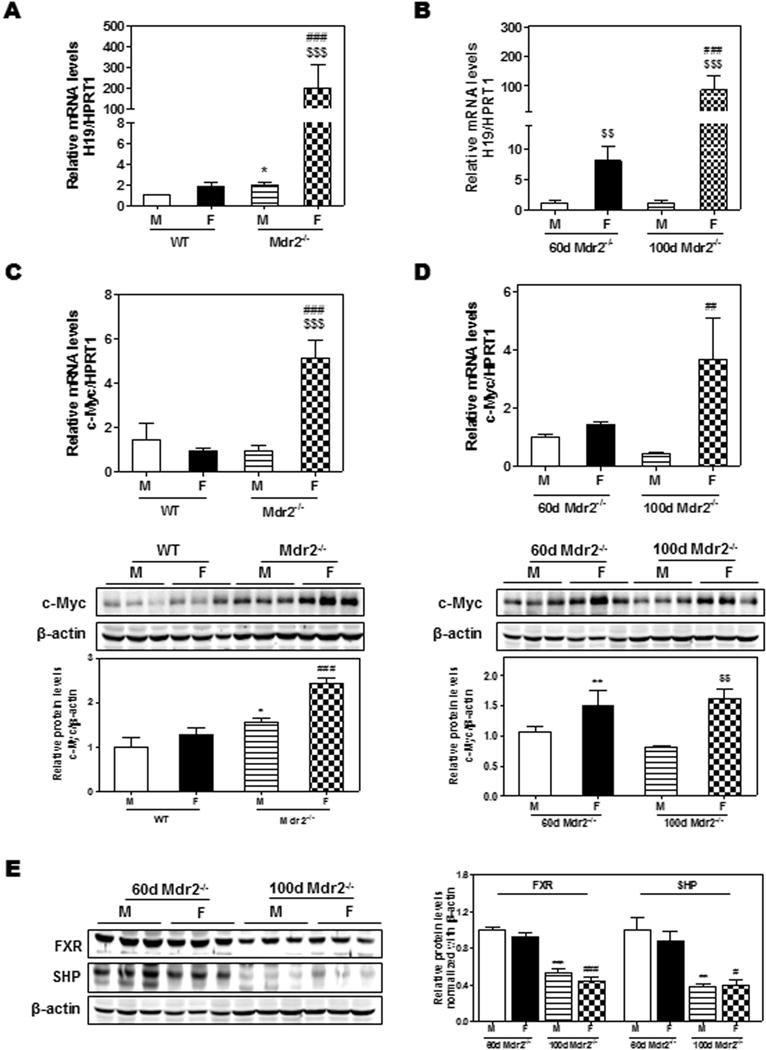
Figure 3. The expression of H19, c-Myc, FXR and SHP in WT and Mdr2−/− mice.

(A) H19 expression levels differ in 100-day-old WT and Mdr2−/− mice; (B) H19 expression levels in 60-day-old and 100-day-old Mdr2−/− mice. (C–D) Comparison of the relative mRNA levels and protein expression levels of c-Myc between 100-day-old WT and Mdr2−/− mice (C) and between 60-day-old and 100-day-old Mdr2−/− mice (D); (E) The protein expression levels of FXR and SHP determined by Western blot analysis and normalized with β-actin as an internal control. Statistical significance: *P<0.05, compared with (M) WT mice; ##P<0.01, ###P<0.001, compared with (F) WT mice; $$P<0.01, $$$P<0.001, compared with 100-day-old (M) Mdr2−/− mice (n=6).
