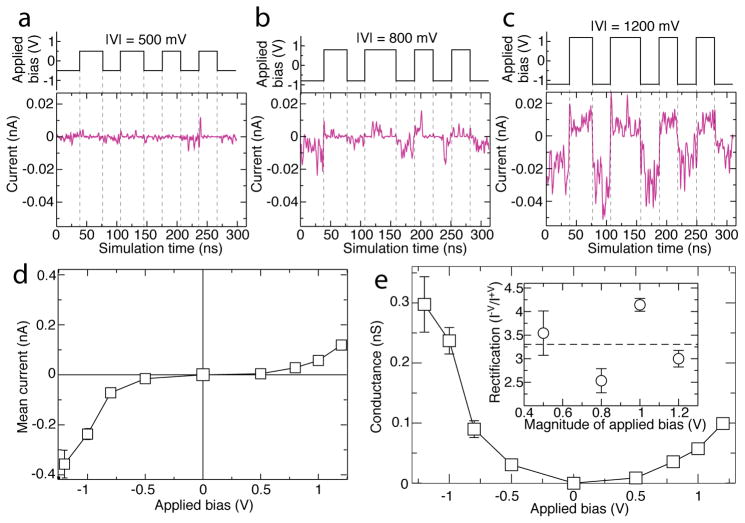
Figure 2.
Ionic current, conductance, and rectification of truncated AQP system. (a–c) Ionic current across truncated AQP embedded in a lipid membrane, Figure 1c,d, at ±500 mV, ±800 mV, and ±1200 mV biases respectively, with magnitude of bias given as —V— at the top of each panel. Data at ±1000 mV are reported in Figure S1. Purple traces indicate current whereas step-function black traces indicate the applied transmembrane bias versus simulation time. The ionic current traces show 2 ns running average of the instantaneous current sampled every 9.6 ps. Dashed lines serve as guides for the eye. Positive current travels from cis to trans as defined in Figure 1c. (d,e) Mean ionic current (d) and ion conductance (e) of the truncated AQP tetramer as a function of transmembrane bias. Mean current is calculated by, first, finding the time-average of the ionic current across the tetramer for each constant bias fragment of the trajectory. The weighted average of these currents is the mean current reported. Error bars in both panels indicate the standard deviation of the mean. The mean conductance and its standard deviation are found by dividing mean current by magnitude of applied bias. The inset of (e) shows the ratios of the current at negative biases to the current at the corresponding positive biases. Error bars specify the propagated standard deviations in the mean currents.

