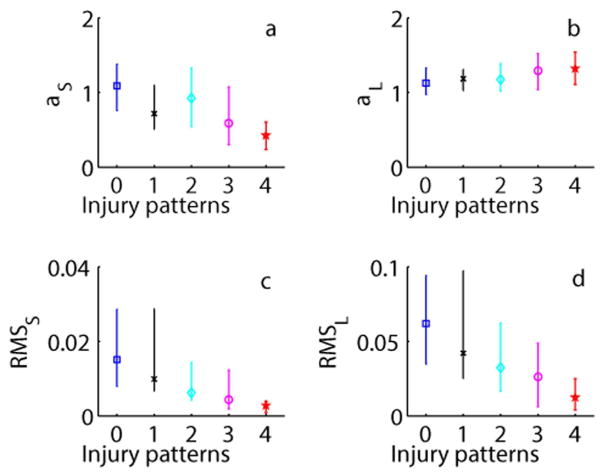
Figure 1. DFA Metrics.
Detrended fluctuation analysis (DFA) metrics: (a) αS, (b) αL, (c) root mean square at short (RMSS) and (d) long (RMSL) time scales presented as median (interquartile range). Injury pattern groups are defined as: 0=no injury, 1=pure cortical/WMI, 2=mixed WS/mild BN, 3= predominant BN or global injury, and 4=died.
Detrended fluctuation analysis (DFA) metrics: (a) αS, (b) αL, (c) root mean square at short (RMSS) and (d) long (RMSL) time scales presented as median (interquartile range). Injury pattern groups are defined as: 0=no injury, 1=pure cortical/WMI, 2=mixed WS/mild BN, 3= predominant BN or global injury, and 4=died.

