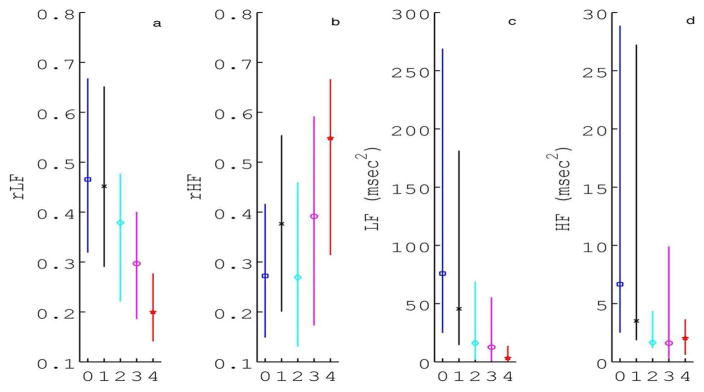
Figure 2. SA Metrics.
Spectral analysis (SA) metrics a) relative low frequency (rLF) and b) high frequency (rHF) power presented as median (interquartile range). Absolute c) LF and d) HF power are also shown for comparison. Injury pattern groups are defined as: 0=no injury, 1=pure cortical/WMI, 2=mixed WS/mild BN, 3= predominant BN or global injury, and 4=died.
Spectral analysis (SA) metrics a) relative low frequency (rLF) and b) high frequency (rHF) power presented as median (interquartile range). Absolute c) LF and d) HF power are also shown for comparison. Injury pattern groups are defined as: 0=no injury, 1=pure cortical/WMI, 2=mixed WS/mild BN, 3= predominant BN or global injury, and 4=died.

