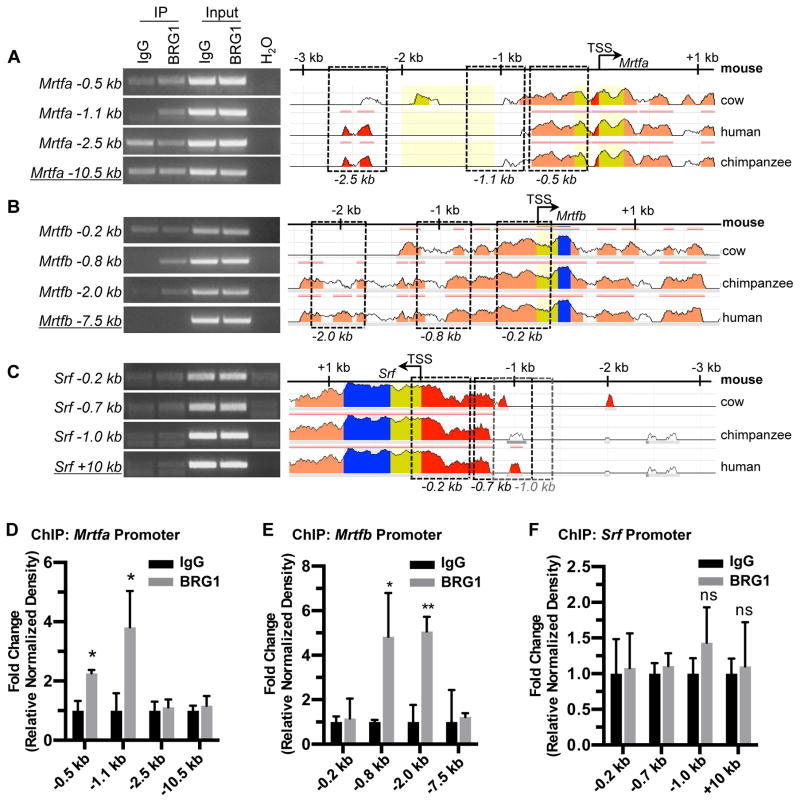
Figure 4. BRG1 interacts with the Mrtfa and Mrtfb promoters in endothelial cells.
Chromatin immunoprecipitation (ChIP) assays were performed in C166 endothelial cells using antibodies against BRG1 or rabbit IgG (as a negative control). (A–C): Immunoprecipitated (IP) DNA was isolated and amplified by PCR to determine whether BRG1 bound conserved regions of the Mrtfa (A), Mrtfb (B), or Srf (C) promoters. Input DNA was isolated from chromatin prior to IP and was used to confirm PCR efficiency. H2O was amplified instead of DNA as a negative control for PCR. Promoter sequence conservation between mouse and other designated species was assessed using the NCBI DCODE website (http://www.dcode.org); peak heights indicate degree of sequence homology. Boxed regions indicate PCR amplicons selected for analysis and are labeled below according to their average distance from each transcription start site (TSS). Negative control amplicons (underlined) are not shown on the sequence alignments but were selected based on their greater distances from each TSS. (D–F): PCR band densities from three independent experiments were quantified using ImageJ, normalized to IgG controls for each experiment, and combined. Data are presented as fold change over the IgG ChIP levels; error bars represent S.D. Statistical calculations were performed using a two-tailed Student’s t test (*, P<0.05; **, P<0.01; ns=not significant).

