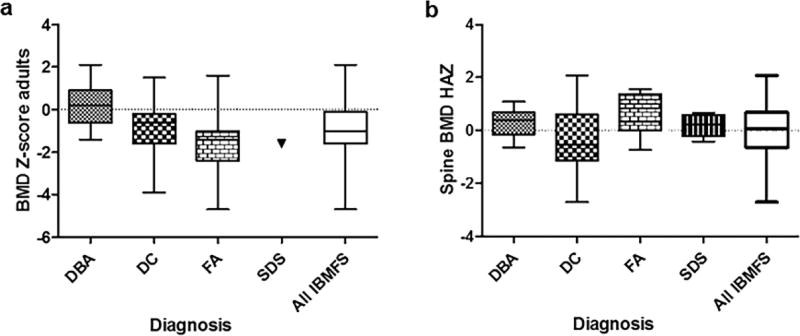
Figure 1. Distributional plot of bone mineral density at the lumbar spine by diagnosis (a) in adults and (b) children.
rp is the Pearson Correlation Coefficient
In adults, (a) BMD Z-score was statistically significantly different by diagnosis (p=0.034, FA vs. DBA driving the significant difference). (b) There were no statistically significant differences in BMD HAZ (p=0.12) among diagnoses in children; data at lumbar spine is shown.

