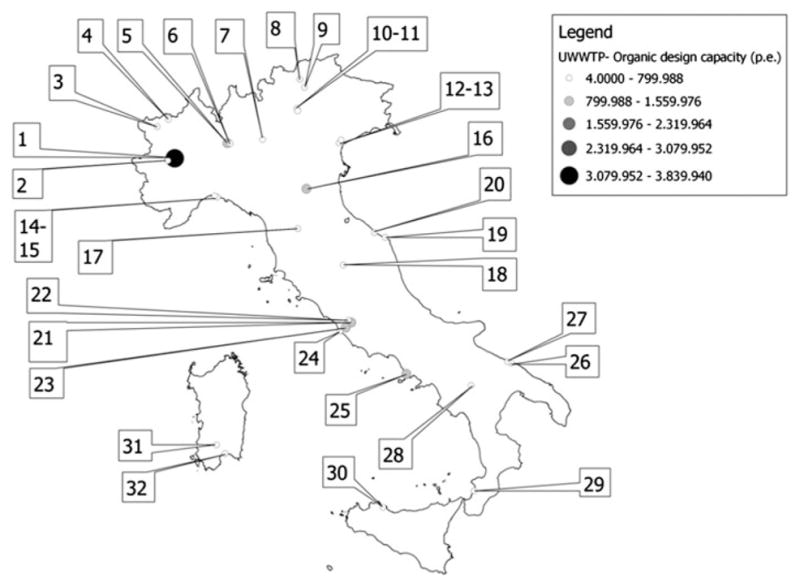
Fig. 1.

GIS map of the WTPs under study. The geographic information system map shows the localization of the 32 WTPs under study. Further details (European Environment Agency WTP code, Population Equivalents served by each WTP, and number of positive samples/WTP) are given in Table 1. The map was created using Quantum GIS (QGIS) version 1.8.0-Lisboa (www.qgis.org), an open source geographic information system licensed under the GNU General Public Licence
