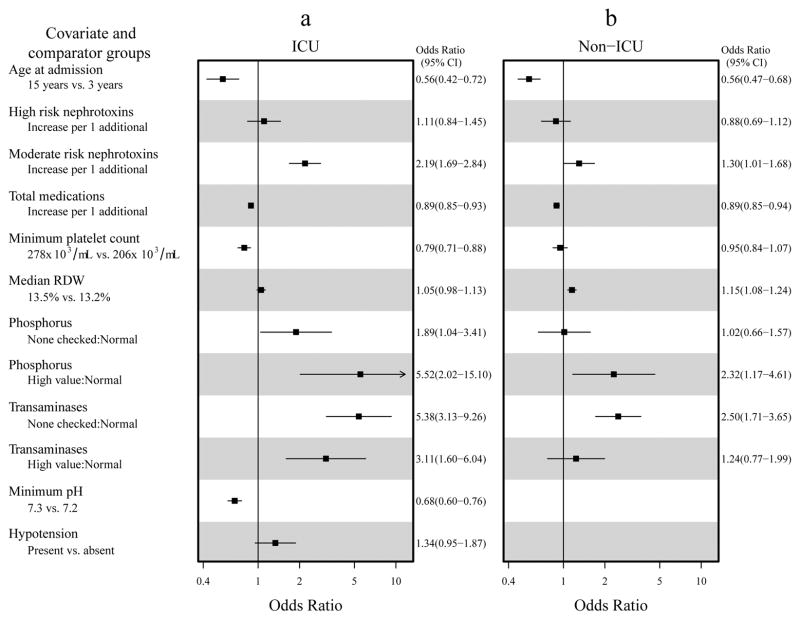
Figure 2.
Odds Ratios for individual factors included in the acute kidney injury risk prediction for ICU (a) and non-ICU (b) patients. Odds ratios depicted are for age (15 vs. 3 years at admission), increase in 1 high risk nephrotoxin, increase in 1 moderate risk nephrotoxin, additional 1 total medication, minimum platelet count (278 vs. 206 × 103/μL), median RDW (13.5% vs. 13.2%), highest phosphorus (none checked vs. normal and one or more high value vs. all normal), transaminases (none checked vs. normal and one or more high value vs. all normal), minimum pH (7.3 vs. 7.2, ICU only), and presence vs. absence of hypotension (ICU only). Point estimates and 95% confidence intervals for each odds ratio are shown to the right of each plot. ICU – Intensive care unit; RDW – red cell distribution width.

