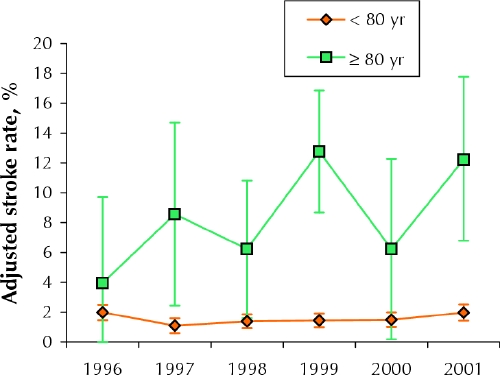
Fig. 2: Adjusted stroke rates over time (with 95% confidence intervals). For patients less than 80 years old, p for linear trend = 0.61; for those 80 years of age and older, p for linear trend = 0.08. The rates were adjusted for the following variables: centre, sex, urgency, presence of diabetes, preoperative renal failure, ejection fraction, hypertension, cerebrovascular disease, peripheral vascular disease, chronic obstructive pulmonary disease, heart failure, previous myocardial infarction, redo surgery and left main disease; age and year of surgery were excluded.
