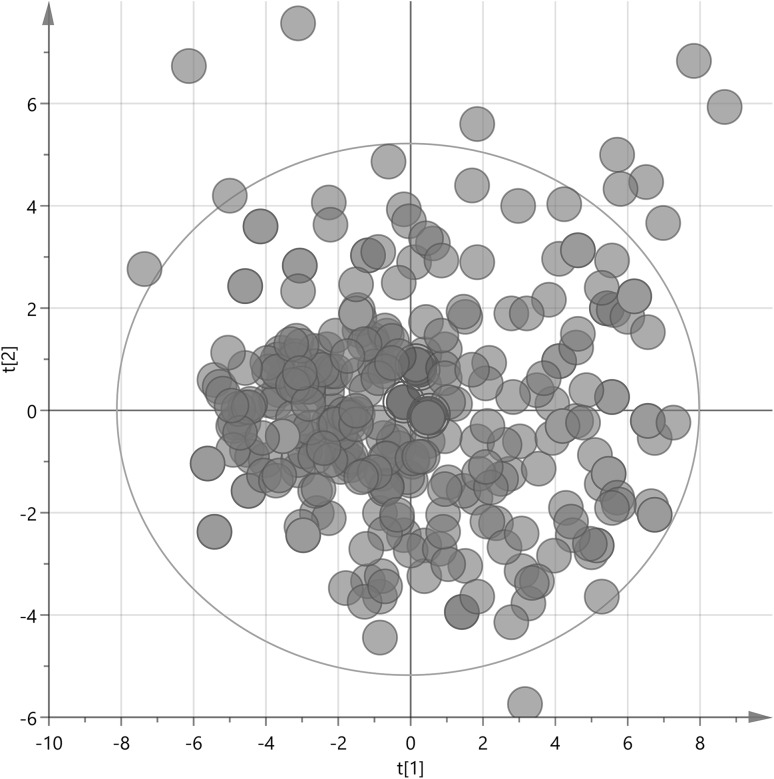
Fig. 2.
Sample selection from controls. From the PCA model (R2X[1] = 0.107, R2X[2] = 0.044), 20 samples from the full two-level factorial design corners (5 from each) + 3 center points were selected so that they spanned the entire multivariate space defined by samples and their associated clinical data. Selected samples are marked in green (design corners) and red (center points); samples that were not selected are marked in gray

