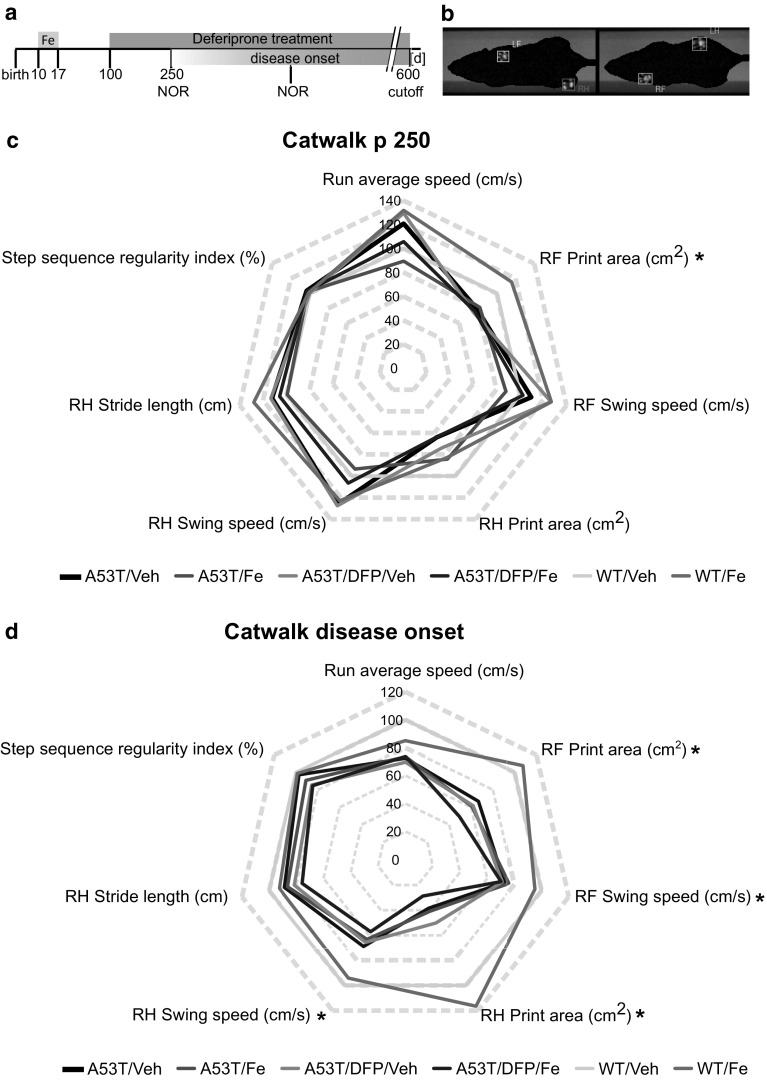
Fig. 3.
Catwalk™ gait analysis. a. A53T and WT littermate mice were treated with 40 mg/kg bw Fe carbonyl for 8 consecutive days (from p10 to p17), at p100 animals were supplied with 10 mg/kg bw of the Fe chelator DFP. Catwalk analysis was performed at p250 and disease onset. b. Example of footprint recording (RF = right front, LF = left front, RH = right hind, LH = left hind). c. Radar chart displaying the results of seven recorded gait parameters as difference in percent from the WT/Veh group at p250. n = 5 for all groups, except for A53T/DFP/Veh n = 4. d. Radar chart displaying the results of seven recorded gait parameters as difference in percent from the WT/Veh group at day of disease onset. *p < 0.05; A53T/Veh n = 4, A53T/DFP/Veh n = 5, A53T/Fe and A53T/DFP/Fe n = 8, WT/Veh n = 10

