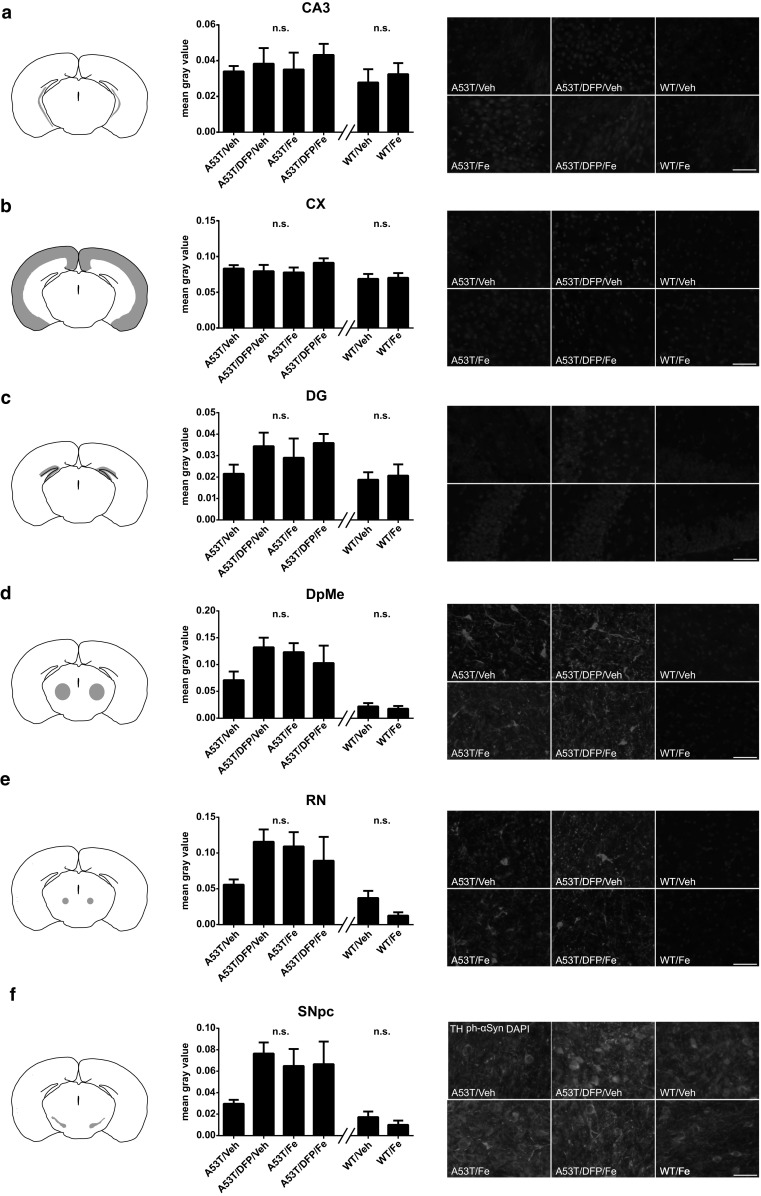
Fig. 6.

Histological evaluation of aSyn aggregation in A53T mice at disease onset using a p-S129-aSyn antibody for all the regions tested. This posttranslational modification was shown to be found in the aggregated form of aSyn only. Each row shows a scheme of the analyzed region, a quantification of p-S129-aSyn signal through fluorescence intensity (n=5 animals for each group), and representative photomicrographs. a. CA3 region; b. cortex (CX); c. dentate gyrus (DG); d. deep mesencephalic reticular nucleus (DpMe); e. red nucleus (RN); f. substantia nigra (SN). Scale bar = 20 µm
