Figure 1.

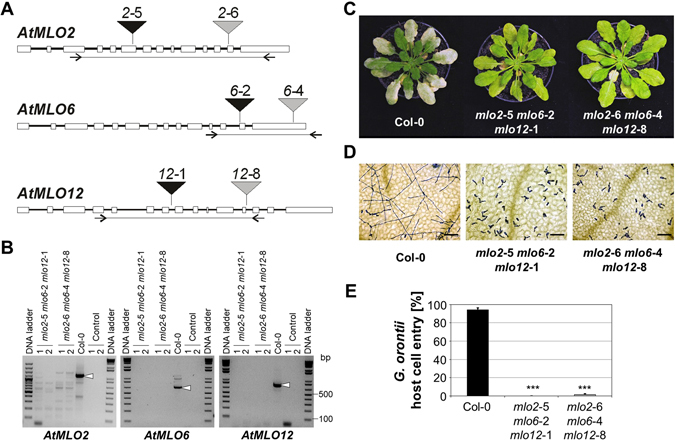
The G. orontii resistance phenotype of the mlo2-6 mlo6-4 mlo12-8 triple mutant is indistinguishable from the mlo2-5 mlo6-2 mlo12-1 triple mutant. Six-week-old Arabidopsis plants were touch-inoculated with G. orontii conidiospores. (A) Scheme depicting the T-DNA insertion sites in MLO2, MLO6 and MLO12. Rectangles represent exons, black lines introns. Triangles symbolize the T-DNA insertion sites of the various mlo alleles. Lines flanked by inverted arrows (primer binding sites) below the gene models indicate the RT-PCR amplicons used to test for MLO transcript accumulation in the mutant lines. (B) RT-PCR analysis of MLO2, MLO6 and MLO12 transcript accumulation. Primer pairs covering the regions indicated in panel A were used to amplify the respective transcript amplicons from cDNA of lines mlo2-5 mlo6-2 mlo12-1 and mlo2-6 mlo6-4 mlo12-8 (two individuals each) as well as Col-0 wild-type plants (positive control). RT-PCR reactions without reverse transcription (control 1) and amplification without template (control 2) served as negative controls. White arrowheads indicate RT-PCR products of the expected size in case of Col-0 wild-type plants. (C) Representative macroscopic infection phenotypes at 8 dpi. (D) Light micrographs visualizing fungal pathogenesis at 48 hpi. Leaf samples were cleared in destaining solution and fungal infection structures subsequently stained with Coomassie Brillant Blue. Bars = 100 µm. (E) Quantitative assessment of host cell entry. Data show the mean ± standard error of the mean (SEM) from three experiments. In each experiment, at least 100 interaction sites from 1-3 leaves of five independent plants per genotype were assessed (total of > 500 interaction sites per genotype and experiment). *** Indicates a statistically significant difference from Col-0 (P < 0.001) according to a GLM test (binomial distribution) on n = 3 independent experimental replicates.
