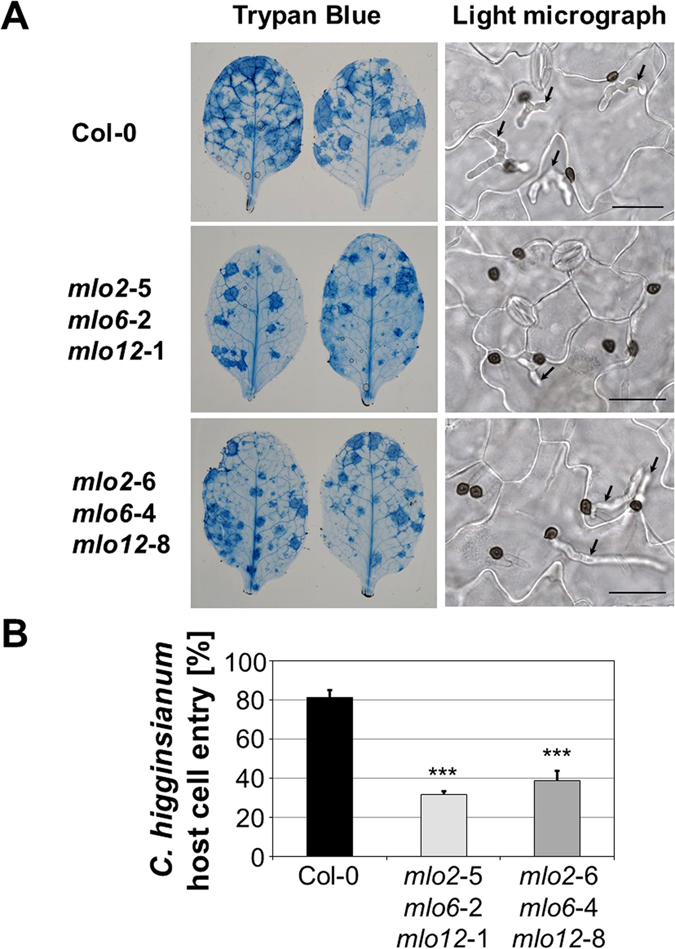
Figure 4.

The mlo2 mlo6 mlo12 triple mutants show decreased host cell entry by C. higginsianum. Infection phenotypes of Col-0, mlo2-5 mlo6-2 mlo12-1 and mlo2-6 mlo6-4 mlo12-8 at 3 dpi with C. higginsianum (isolate IMI349063A). Plants were spray-inoculated with spore suspension (5 × 10⁵ spores ml−1). (A) Representative examples of whole leaves cleared and stained with Trypan blue (left column) and light micrographs showing leaf epidermal cells after clearing in choral hydrate (right column). Biotrophic hyphae (arrows) are visible beneath some melanised appressoria. Bars = 30 μm. (B) Quantitative assessment of host cell entry. Data show the mean ± SD from counts of at least 140 appressoria from each leaf (one leaf from each of 3 different plants), i.e. at least 420 appressoria per plant genotype. ***Indicates a statistically significant difference from Col-0 (P < 0.001) according to a GLM test (Poisson distribution) on n = 3 technical replicates (individual plants). The experiment was repeated once with similar results (Fig. S1).
