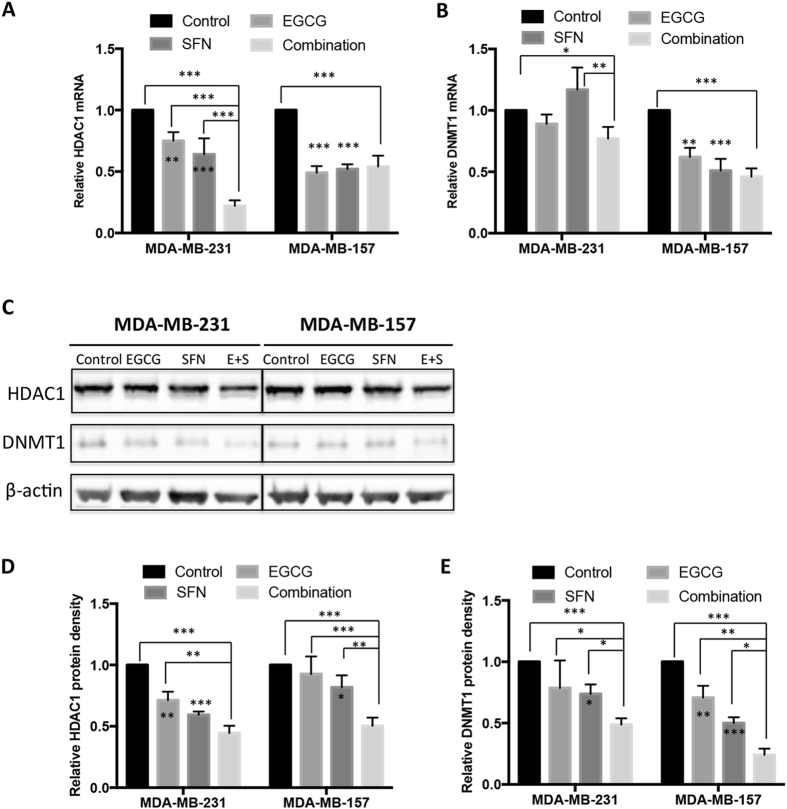
Figure 3.
Gene expressions of HDAC1 and DNMT1 by EGCG and/or SFN treatment. Quantitative real-time PCR was performed to measure relative transcription of HDAC1 (A) and DNMT1 (B) in MDA-MB-231 cells and MDA-MB-157 cells. (C) Protein expression of HDAC1 and DNMT1 in MDA-MB-231 and MDA-MB-157 cells. β-actin was loaded as an internal control. The full-length blots were shown in the Supplementary Information. (D) HDAC1 protein quantification. (E) DNMT1 protein quantification. Data were in triplicate from three independent experiments and normalized to internal control and calibrated to levels in untreated samples. E + S, EGCG and SFN in combination; Columns, mean; Bars, SD; *p < 0.05; **p < 0.01; ***p < 0.001, significantly different from control or the indicated comparisons.

