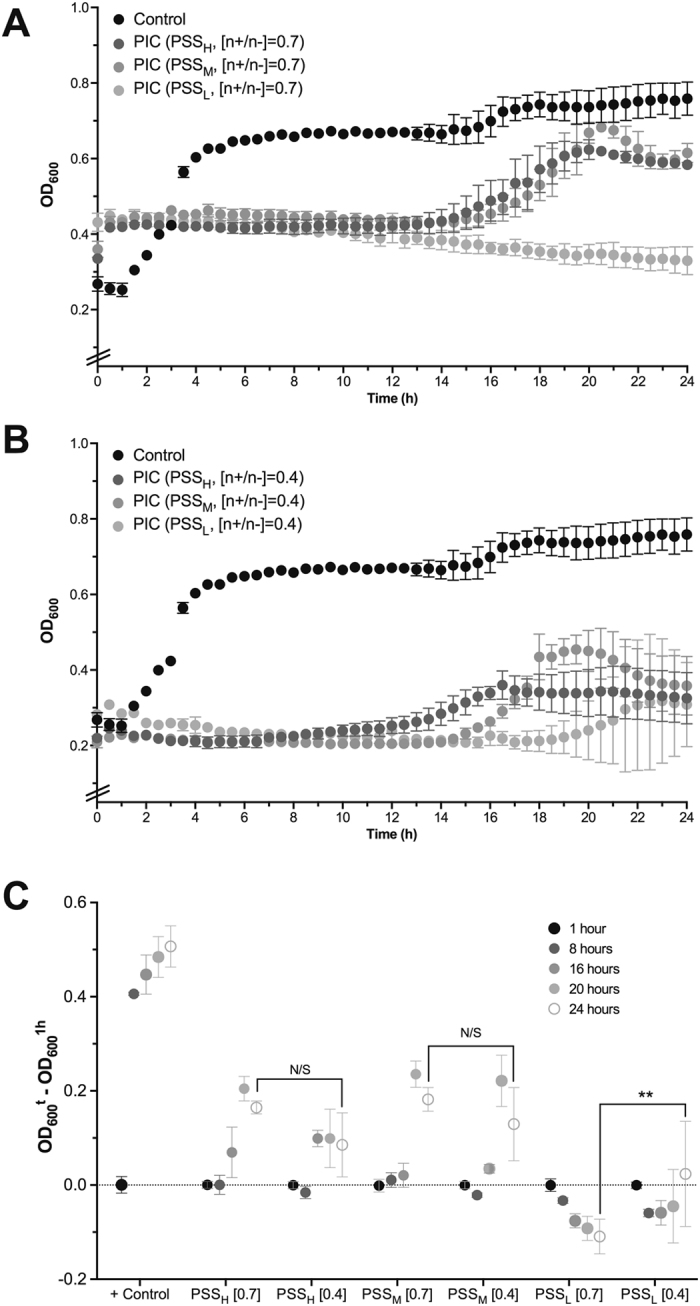
Figure 6.

Change in optical density at 600 nm (OD600) for P. aeruginosa cultures in the absence (⦁) and presence of PSS containing PIC nanoparticles prepared at 0.7 (A) or 0.4 (B) [n+/n−] ratios. Error bars represent the standard deviation, n = 3. (C) Representative relative changes in OD600 from P. aeruginosa cultures in the absence (+Control) and presence of PSS containing PIC nanoparticles prepared at 0.7 or 0.4 [n+/n−] ratios, indicated in brackets. **p < 0.01, ‘N/S’ = not significant (two-way ANOVA, Tukey test, CI = 95%). Error bars represent the standard deviation, n = 3.
