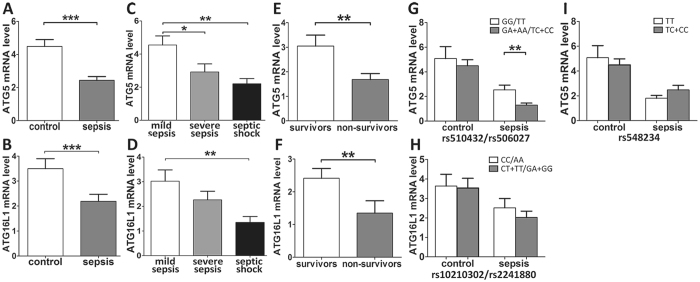
Figure 3.
Real-time PCR analysis of the ATG5 and ATG16L1 mRNA expression in sepsis patients and healthy controls. Expression levels of ATG5 and ATG16L1 in sepsis patients and healthy controls (A,B). Expression levels of ATG5 and ATG16L1 in mild sepsis, severe sepsis and septic shock subgroups (C,D). Expression levels of ATG5 and ATG16L1 in 28-day surviving and non-surviving sepsis patients (E,F). The distribution of ATG5 expression in groups of sepsis patients with different rs510432/rs506027 genotypes (G) and different rs548234 genotypes (I). The distribution of ATG16L1 expression in groups of sepsis patients with different rs10210302/rs2241880 genotypes (H). The horizontal line represents the mean expression levels of ATG5 and ATG16L1 with each group. *P < 0.05; **P < 0.01; ***P < 0.001.

