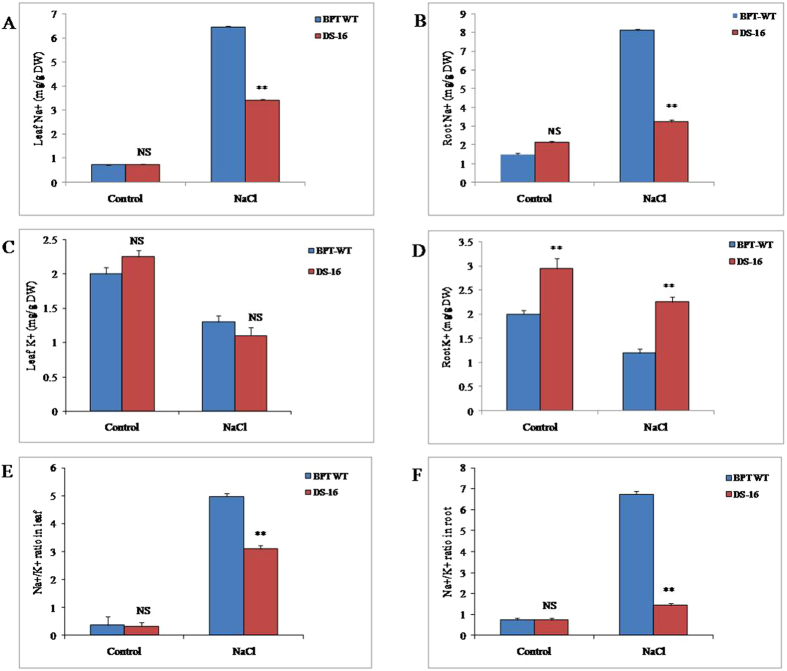
Figure 7.
Estimation of Sodium and potassiumcontent of salt tolerant activation tagged DS-16 line. (A) Leaf Na+, (B) root Na+, (C) leaf K+, (D) root K+, (E) Leaf Na+/K+ ratio, (F) root Na+/K+ ratio. Two weeks old rice seedlings from DS-16 and WT-BPT were treated with 150 mM NaCl stress for two weeks. Ion accumulation was estimated before and after stress treatment in DS-16 and WT. Three rice seedlings were used in each treatment and three independent biological repeats were performed for each treatment with error bar. * indicates significant differences in comparison with the WT at P < 0.05, **P < 0.01, NS - non significant.

