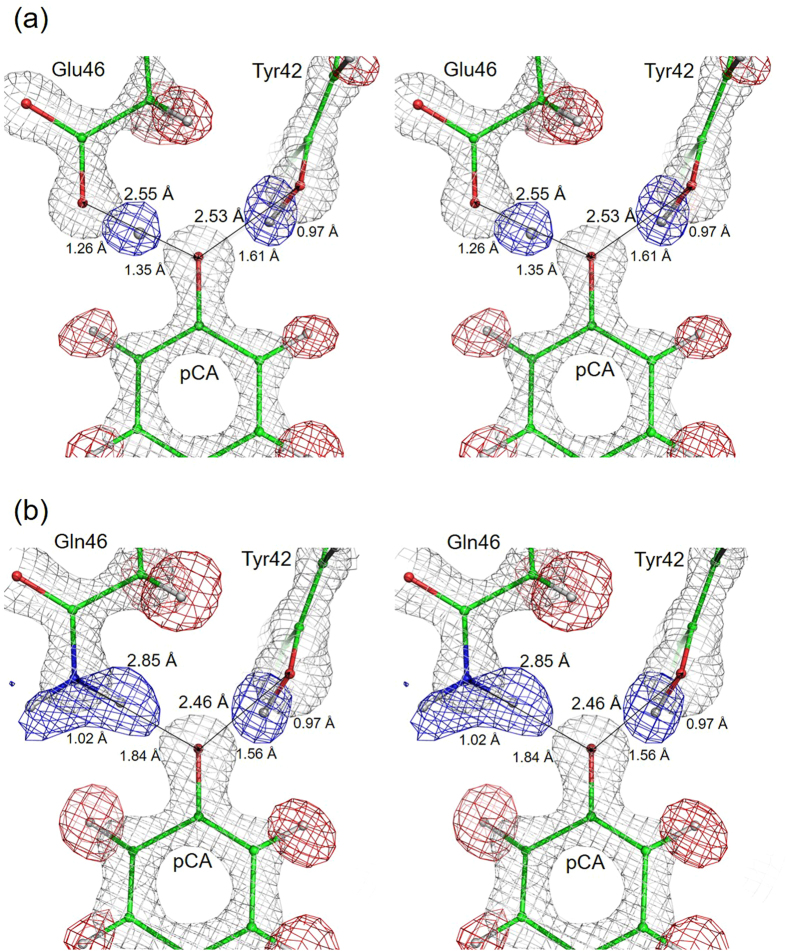
Figure 1.
Hydrogen bonds near the chromophore, including hydrogen and deuterium atoms. Nuclear and electron density maps superposed on the structural models of WT (a) and E46Q (b). Blue meshes represent positive nuclear density of the Fo–Fc maps omitting each deuterium atom involved in the two hydrogen bonds, contoured at 5.0σ. Red mesh represents the Fo–Fc nuclear density maps, contoured at −5.0σ, omitting the hydrogen atoms. 2Fo–Fc electron density maps of heavy atoms contoured at 3.5σ (a) and 3.0σ (b) are also shown.

